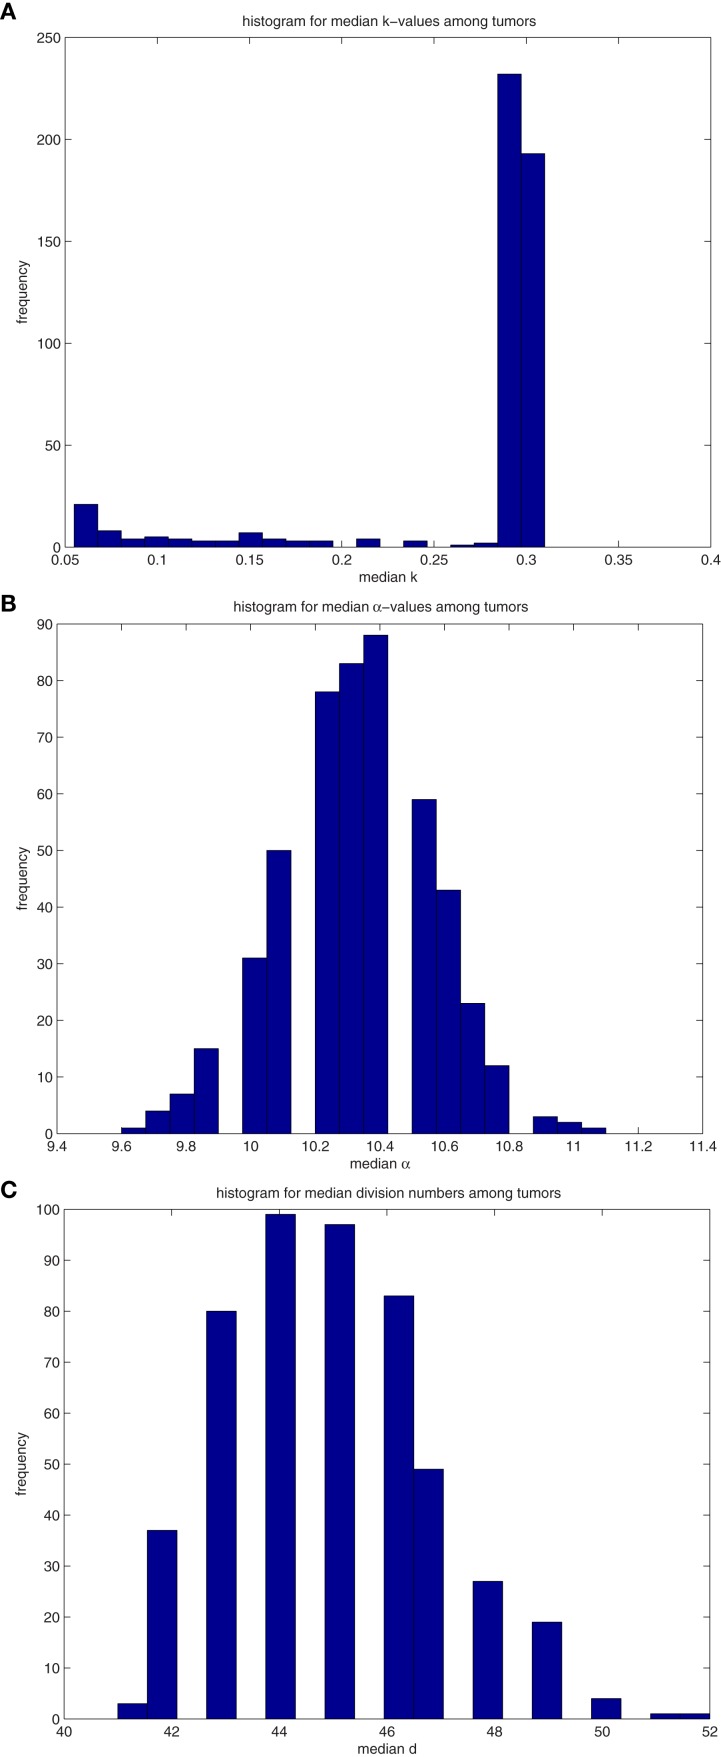
Figure A3.
(A)Histograms for the median values of differentiation coefficient k from 500 tumors spawned from TICCs. (B) Histograms for the median values of proliferation potential α from 500 tumors spawned from TICCs. (C) Histograms for the median values of division number d from 500 tumors spawned from TICCs.

