
Figure 2.
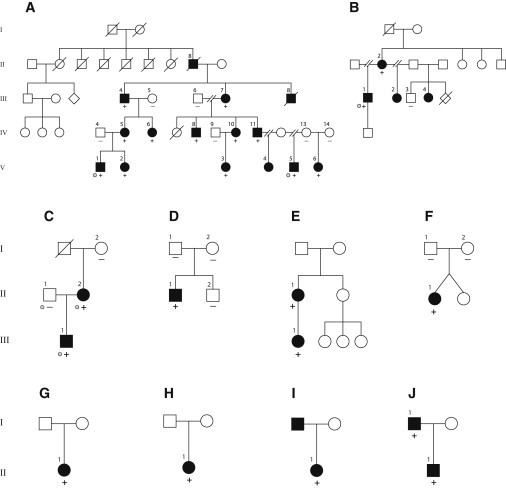
Pedigrees of Families A–J
Pedigrees illustrating the relationships and affected status of ten families affected by SEN syndrome. Case identifiers correspond to those in Table 1 and Table S1. Grey dots indicate individuals who underwent exome sequencing. Plus signs (+) indicate individuals in whom mutations were identified, and minus signs (–) indicate individuals in whom no mutation was found. Family A individuals with a plus or minus sign (except individuals IV-14 and V-6) were also included in the linkage analysis.