
Figure 2.
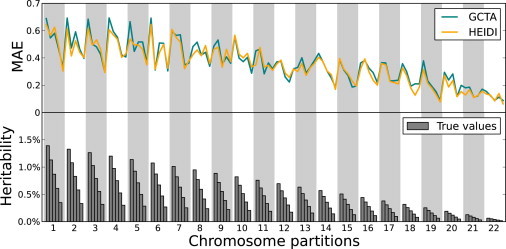
Simulations Using Varying Heritability Contributions
MAE values obtained by HEIDI and GCTA are shown in each region in the simulations where the total heritability is 50% and the regions have heritability contributions that vary across the genome. In this scenario, the accuracy of HEIDI is 3.64% higher than that of GCTA.