
Figure 3.
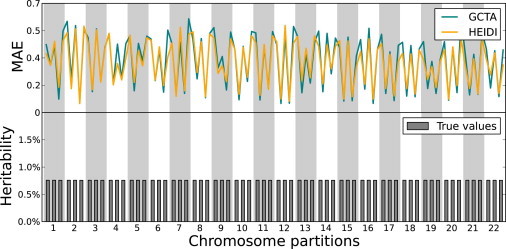
Simulations Using Sparse Heritability Contributions
MAE values obtained by HEIDI and GCTA are shown in each region in the simulations where the total heritability is 50% and in each chromosome, the second and fourth regions do not contribute to the heritability, and the first, third, and fifth regions have equal contributions. In this scenario, the accuracy of HEIDI is 3.36% higher than that of GCTA.