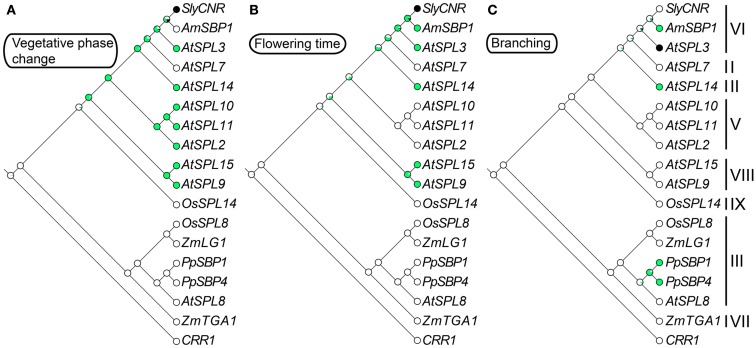
Figure 2.
Ancestral character state reconstructions across the SPL gene family. The gene trees are based on Figure 1, but only include genes for which functional data are available. Character state transitions in vegetative phase change (A), flowering time (B), and branching (C) were inferred from a ML analysis in Mesquite version 2.5 (Maddison and Maddison, 2008) under the Mk1 (single rate of change between states) model of evolution. Circles denote the probability of having (green) or not having (white) a particular function. Black circles are coded as unknown.

