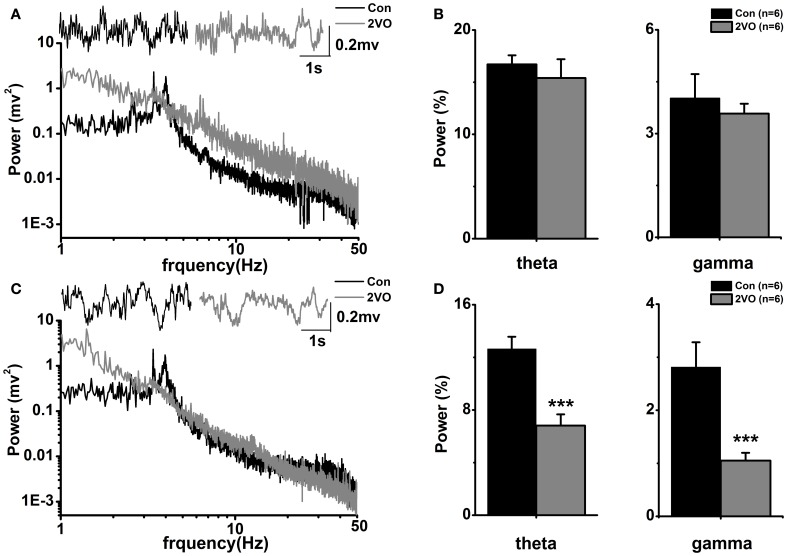
Figure 1.
Power spectral analysis in the two groups. (A) Representative local field potential traces and corresponding power spectra in hippocampal CA1 regions in one normal rat (black line) and one 2VO rat (gray line). (B) Statistical analysis of relative theta and gamma power spectra in CA1 region in the two groups. (C) Same display as (A) in CA3 region. (D) Same display as (B) in CA3 region. ***p < 0.001 comparison between Con and 2VO groups.

