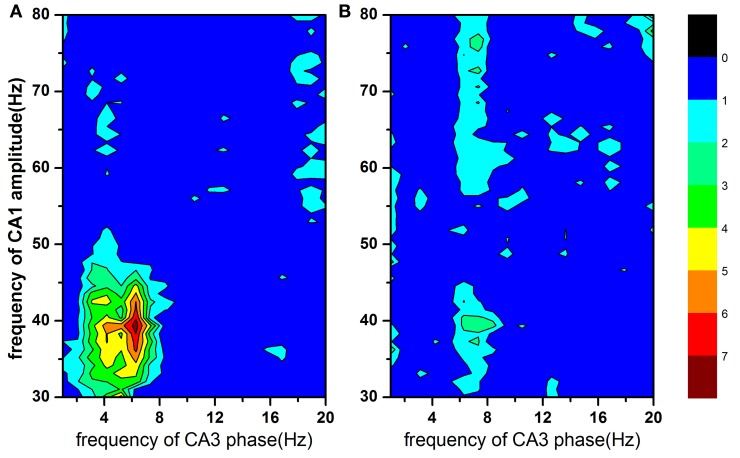
Figure 3.
The modulation index as a function of analytic amplitude (30–80 Hz) in CA1 and analytic phase (1–20 Hz) in CA3. Larger MI value indicates stronger cross frequency coupling. Strong phase-amplitude coupling between CA3 and CA1 existed at CA1 slow gamma band (30–50 Hz) in normal rats (panel A), however, almost disappeared in brain ischemia rats (panel B).

