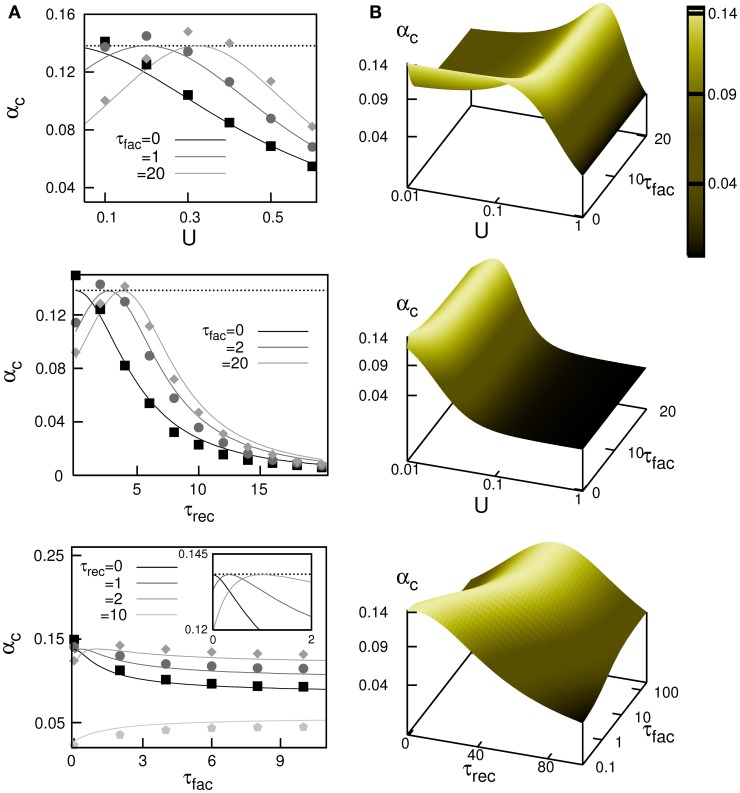
Figure 3.
Maximum storage capacity obtained in attractor neural networks with dynamic synapses with both depressing and facilitating mechanisms. (A) Behaviour of αc as a function of U, τrec and τfac. The solid lines correspond the theoretical prediction from the mean field Equation (14) and symbols are obtained from Monte Carlo simulations. From top to bottom, it is shown αc(U) for τrec = 2 and different values of τfac, αc(τrec) for U = 0.2 and different values of τfac and αc(τfac) for U = 0.2 and different values of τrec, respectively. The horizontal dotted lines correspond to the static synapses limit αc ≈ 0.138. (B) Mean-field results from Equation (14) for the dependence of αc for different combinations of relevant parameters. This corresponds—from top to bottom—to the surfaces αc(U, τfac) for τrec = 2, αc(U, τfac) for τrec = 50 and αc(τrec, τfac) for U = 0.02. In all panels, τrec and τfac are given in MCS units that can be associated to a value of 5 ms if one assumes that a MCS corresponds to the duration of the refractory period in actual neurons.

