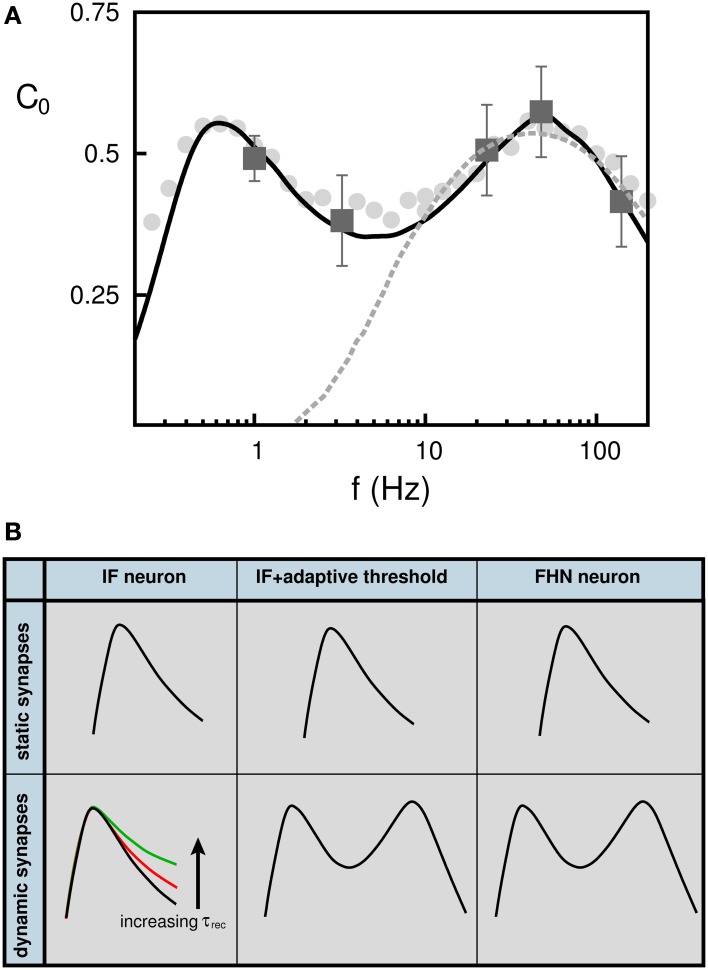
Figure 6.
(A) Appearance of stochastic multi-resonance in experiments in the brain. Dark gray square symbols represent the values of C0 obtained in the experiments performed in the human auditory cortex. Dashed light gray line corresponds to best model prediction using a neuron with fixed threshold (Yasuda et al., 2008). Solid black line correspond to our model consisting of a FHN neuron and depressing synapses. Gray filled circle symbols shows C0 when the weak signal is a train of (uncorrelated) Poisson pulses instead of the sinusoidal input (solid line). (B) Schematic overview showing the neuron and synapse mechanisms needed for the appearance of stochastic multi-resonances in feed-forward neural networks. (see (Torres et al., 2011) for more details).

