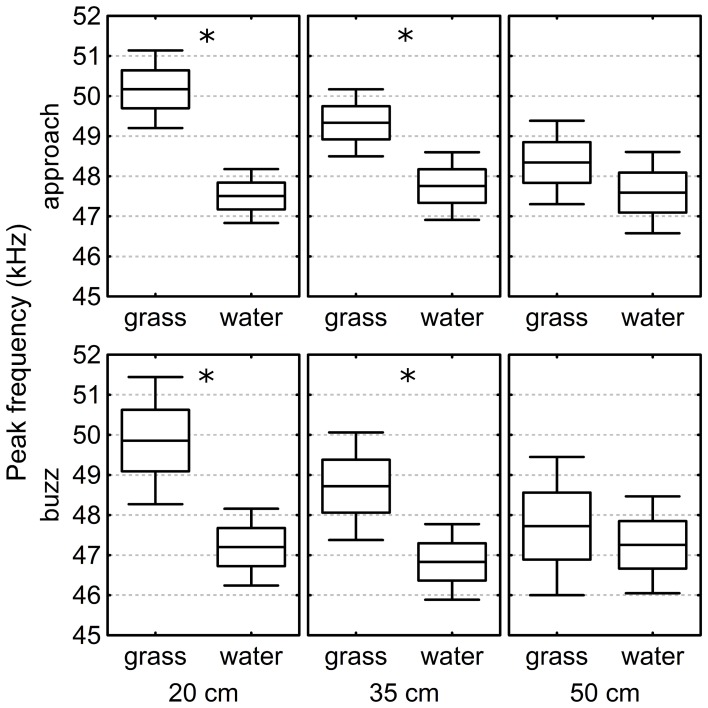
Figure 5.
Peak frequency of the echolocation calls above grass and water in the laboratory. In both, Buzz and Approach phase, and at target heights of both 20 and 35 cm, the peak frequency was significantly higher above grass than above water. At 50 cm height we found no significant differences in the peak frequency between the two surfaces. The box-plots show the mean, the standard error, and the confidence interval. Stars indicate significant differences (p < 0.001) (see call analysis section).

