
Figure 1. Behaviour of Boltzmann machines for a maximum cut problem (g05_100.0).
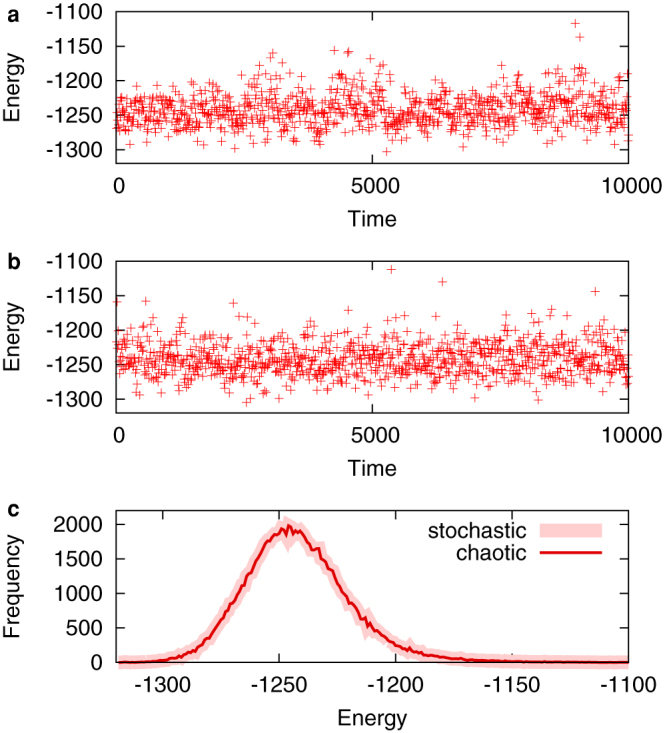
Typical time evolutions of (a) chaotic and (b) stochastic Boltzmann machines for T = 128. Energy values are sampled every 10 unit time. (c) Histograms of the energy values sampled 100,000 times from chaotic (thin red line) and stochastic (thick pink line) Boltzmann machines.