
Figure 3.
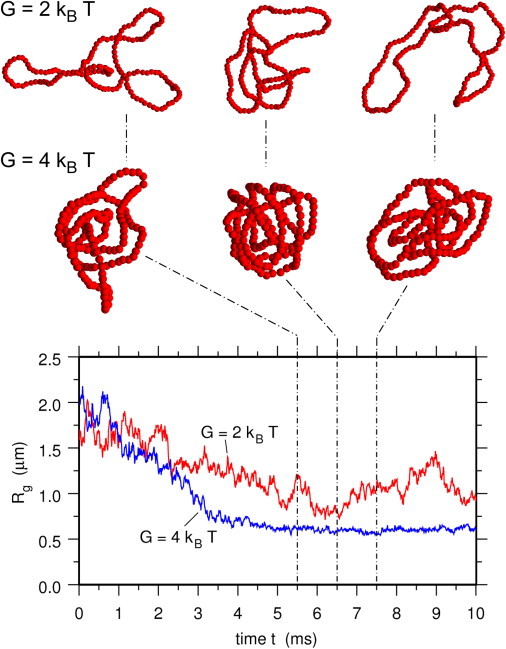
Time evolution of the radius of gyration of the plasmid molecule (3D simulations). (Bottom plot) Time evolution of the radius of gyration of the plasmid molecule for single simulations with G = 2 kBT and G = 4 kBT. (Insets above plot) Conformations of the plasmid molecule at t = 5.5 ms, 6.5 ms, and 7.5 ms for G = 2 kBT (top row) and G = 4 kBT (second row). H-NS dimers are not shown for clarity.