
Figure 5.
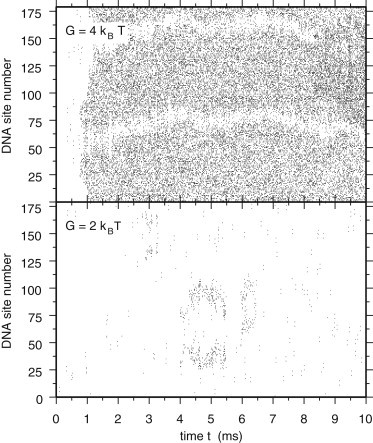
Time evolution of bridged DNA sites (2D simulations). Diagrams showing the time evolution of bridged DNA sites for single 2D simulations with G = 2 kBT (bottom plot) and G = 4 kBT (top plot). DNA sites are numbered from 1 to 179 and reported on the vertical axis. Every 10 μs, the DNA sites occupied by a trans-binding H-NS dimer are listed and ticks are placed in the diagram at the corresponding locations.