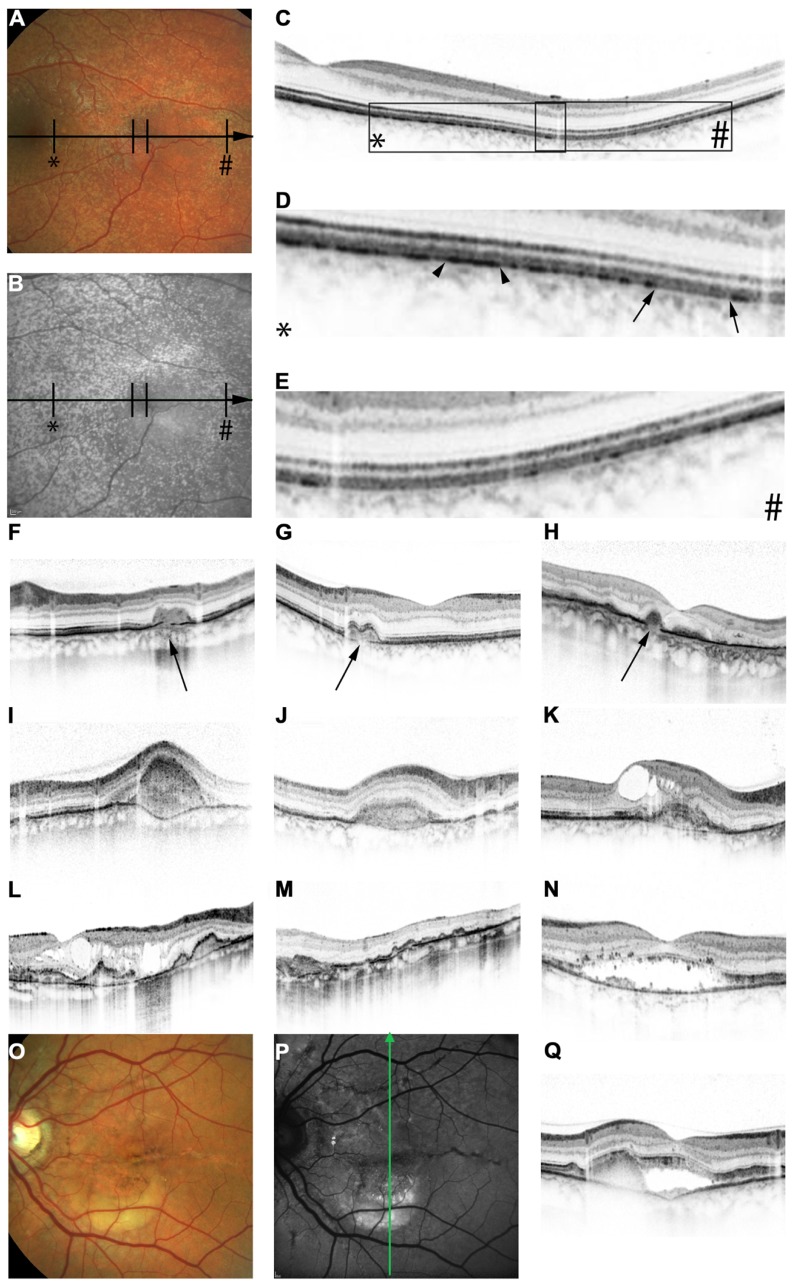
FIGURE 2.
Features of pseudoxanthoma elasticum on optical coherence tomography. Calcification of Bruch’s membrane may be seen on OCT images. This is best illustrated within areas of peau d’orange, the transition zone between calcified and un-calcified Bruch membrane (A–E). The horizontal arrow in (A) and (B) indicates the placement of the OCT scan in (C). 2.5x magnifications of characteristic details in (C) are shown in (D,E). Area * corresponds to (D) and area # to (E). Areas of increased reflectivity within the outer zone of RPE-Bruch’s membrane complex (arrow heads in D) correlate to the whitish opaque fundus reflex on color images (A) and the increased signal on near-infrared reflectance images (B). Areas of lower reflectivity (E, arrows in D) correlate to the normal fundus reflex. Angioid streaks correlate to breaks within the thickened and hyperreflective Bruch’s membrane (F–H, arrows). Fibrovascular tissue may grow through such breaks (I,J). A typical complication of angioid streaks is the development of choroidal neovascularizations leading to retinal exsudation (K). Eventually, atrophy of the retinal pigment epithelium is associated with atrophic changes in the photoreceptor layer with (L) or without (M) cystoid retinal lesions. In some patients there may be persistent subretinal fluid independent of choroidal neovascularizations (N,Q). If longstanding, a vitelliform lesion may present with deposition of yellowish hyperautofluorescent material at the bottom of the lesion (O–Q). The green arrow in (P) indicates the placement of the OCT scan in (Q).

