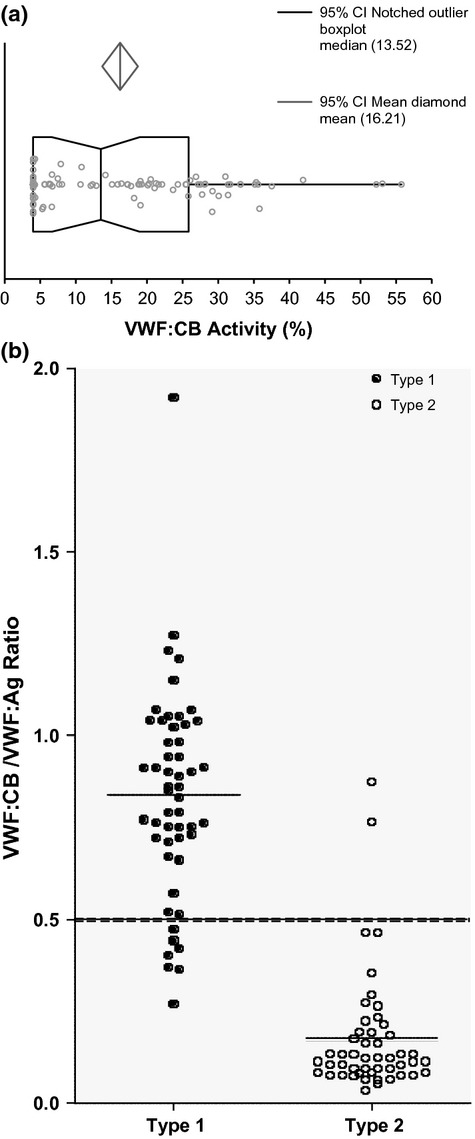
Figure 1.

VWD sample analysis. (a) 101 known VWD samples were run on the VWF:CB ELISA and percent collagen-binding activity was plotted. The median (vertical line) and 95% intervals (box) are shown, as well as the mean confidence intervals (diamond shape, above). (b) Type 1 VWD samples are shown as solid black circles, and type 2 VWD samples are shown as open white circles. The lines in each population represent the mean ratio values of each VWD type. The dashed line represents the VWF:CB/VWF:Ag ratio cutoff (0.5) used to differentiate type 1 from type 2 VWD.
