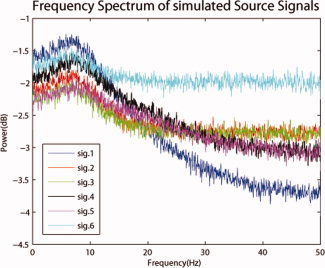
Figure 4.

Spectrum of simulated activation signals. All the signals have peak power around 8 Hz. Sources 1 to 5 which are part of the same causal network have similar spectra. Source 6 which is not part of the causal network has in general more power in all frequencies above 10 Hz. [Color figure can be viewed in the online issue, which is available at wileyonlinelibrary.com.]
