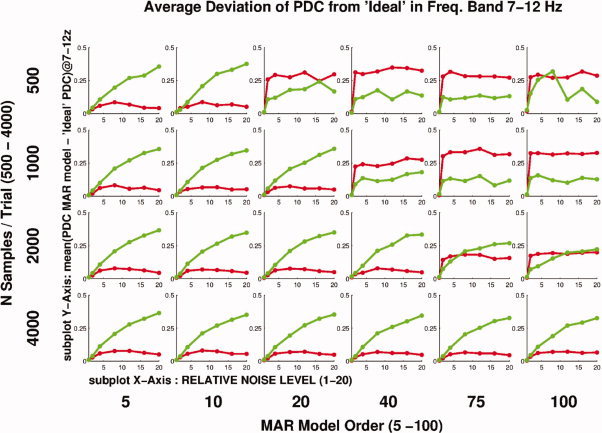
Figure 7.

Average deviation of PDC from ‘Ideal’ for causal and noncausal pairs. Causal pairs are represented by green color, noncausal pairs by red. In each subplot PDC is plotted versus N Samples/Trial. Each subplot corresponds to a different combination of environment noise level and MAR model order. For low N samples/Trial and high MAR model order (top right), PDC fails to capture causality correctly and non‐causal pairs appear to have significant causality. For higher N samples/Trial and lower model order (bottom left) PDC recovers information much more consistently and non causal pairs do not appear to have significant causality. In such cases it can be seen that for noise levels below five times the rms value of the brain signals, the average deviation of both causal and noncausal pairs from the ‘Ideal’ PDC remains low. For noise levels above five the average deviation of the causal pairs seems to systematically increase. [Color figure can be viewed in the online issue, which is available at wileyonlinelibrary.com.]
