
Figure 3. Effects of ACAT inhibition on lesion macrophage content.
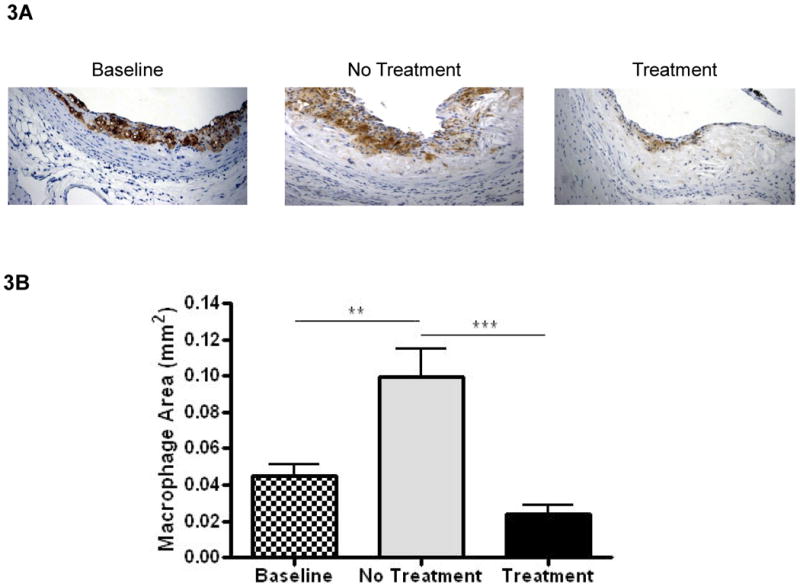
A) Representative sections stained for macrophages using the Mac2 and CD68 antibody were visualized at 200×. B) Bar graph represents measurements of stained areas for Mac2 and CD68. Baseline N=9, No Treatment N=12, and Treatment N=12. Data analyzed by Bonferroni's Multiple Comparison test. Data are expressed as Mean ± SEM. Statistically significant differences (P < 0.05, P < 0.01, and P < 0.001) are represented by *, **, and ***, respectively.