
Figure 5. Effects of ACAT inhibition on measurements of apoptosis and necrosis in atherosclerotic lesions.
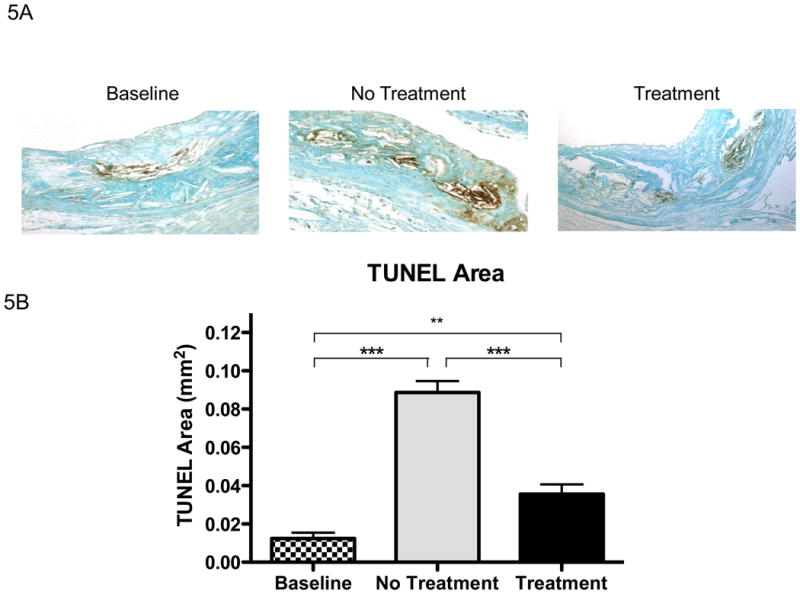

A) Representative sections stained for apoptosis using TUNEL staining and visualized at 200×. B) Bar graph represents measurements of stained areas positive for apoptosis; Baseline N=7, No Treatment N=8, and Treatment N=8. C) % of nuclei that were TUNEL positive in the plaques in each group; Baseline N=7, No Treatment N=8, and Treatment N=8. D) Area of plaque that was necrotic in each group; same N′s as in panel C. Data analyzed by ANOVA, followed by Bonferroni's Multiple Comparison test. Data are expressed as Mean ± SEM. Statistically significant differences (P < 0.05, P < 0.01, and P < 0.001) are represented by *, **, and ***, respectively.