
Figure 2.
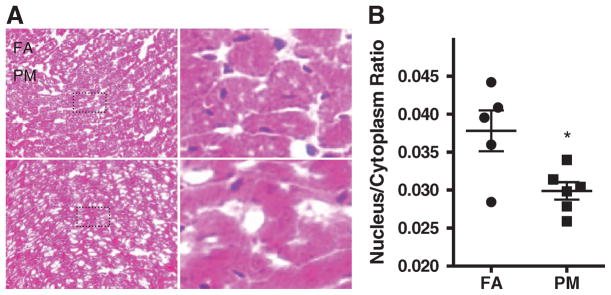
Histological assessments of filtered air (FA) and particulate matter (PM2.5)-exposed hearts. A, Representative heart tissue sections. B, Quantitative analyses of nucleus/cytoplasm ratio. Data are expressed as mean±SEM (n=5) and analyzed using a Student t test. P<0.05 was considered statistically significant.