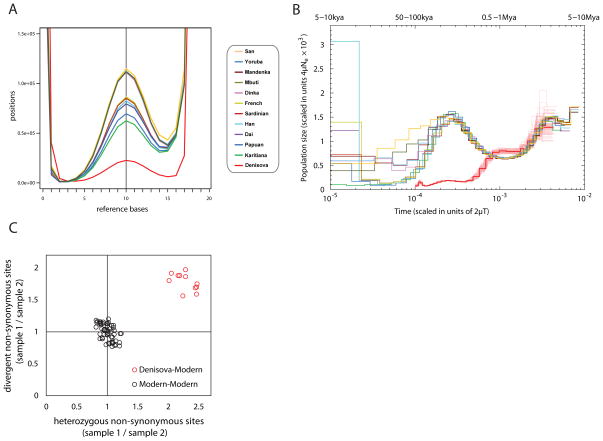
Figure 5.
(A) Heterozygosity shown by the distribution of the number of bases matching the human reference genome at sites sampled to 20-fold coverage. The Y-axis is scaled to show the peak representing heterozygous sites in the center. (B) Inference of population size change over time using variation in the time since the most recent common ancestors across the genome shows that Denisovans have had a small population size over the last few hundred thousand years compared with modern humans, but a similar demographic history earlier. The y-axis specifies a number proportional to the population size Ne. The x-axis specifies time in units of divergence per base pair (along the top in years, assuming rates of 0.5×10⁻⁹ to 1.0×10⁻⁹ per year). Thin red lines around the Denisovan curve represent 100 bootstraps, thus showing the uncertainty of the inference. (C) The small population size in Denisovans is reflected in a greater accumulation of non-synonymous sites (normalized by the number of synonymous sites), whether measured in terms of heterozygous sites in Denisovans vs. modern humans (ratio 2.0 –2.5), or the accumulation of divergent sites on the Denisovan lineage divided by modern human lineages (ratio 1.5–2.0). The analysis is restricted to non-synonymous sites predicted to have a possibly or probably damaging effect on protein structure or function.

