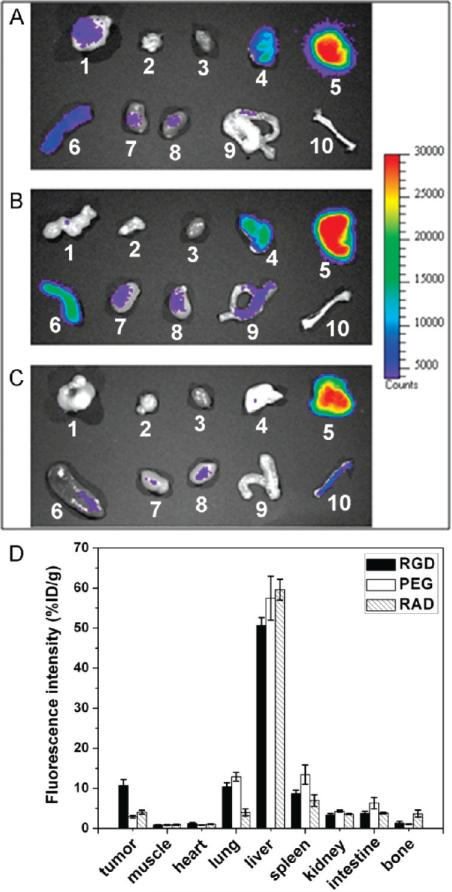
Figure 5.
Ex vivo NIR fluorescence imaging after 4 h p.i. of (A) QD800-RGD, (B) QD800-PEG, and (C) QD800-RAD. In each image 1, U87MG tumor; 2, muscle; 3, heart; 4, lung; 5, liver; 6, spleen; 7, kidney (left); 8, kidney (right); 9, intestine; and 10, bone. (D) ROI analysis of major organs in ex vivo fluorescence imaging after 4 h p.i. of QD800-RGD, QD800-PEG, and QD800-RAD. The data are represented as mean ± standard deviation (SD), n = 3/group.

