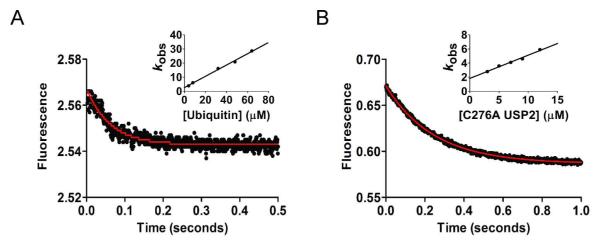
Figure 3.

Stopped-flow fluorescence traces of ubiquitin and Ub-AMC binding to the USP2 catalytic core. (A) Stopped-flow fluorescence traces of ubiquitin binding to USP2 obtained by USP2 tryptophan fluorescence quenching. (B) Stopped-flow fluorescence traces of Ub-AMC binding to C276A USP2. The data were fit to a single exponential function (solid red line) using GraphPad Prism (GraphPad Software, CA). The fitted rates were plotted against the concentration of either ubiquitin (inset in panel A) or USP2 (inset in panel B). The binding and dissociation constants, kon and koff, were determined through linear regression (described in the Experimental Procedures section).
