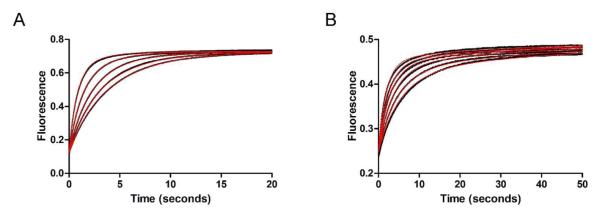
Figure 7.

Stopped-flow fluorescence kinetic traces of USP2-catalyzed hydrolysis of Ub-AMC and K48-linked IQF diubiquitin under single-turnover conditions. (A) USP2-catalyzed hydrolysis of Ub-AMC. Fluorescence changes (black dots) were monitored over 20 seconds. USP2 concentration was varied (1.25, 1.5, 2.0, 3.0, and 5.0 μM) and shown in ascending order while Ub-AMC concentration was held constant at 0.2 μM. The data was then globally fit (red line) to reaction Scheme 1. (B) USP2-catalyzed hydrolysis of K48-linked IQF diubiquitin. Fluorescence changes (black dots) were monitored over 50 seconds. USP2 concentration was varied (1.25, 1.5, 2.0, 2.5, 3.0, and 4.0 μM) and shown in ascending order while K48-linked IQF-diubiquitin concentration was held constant at 0.2 μM. The data was then globally fit (red line) to reaction Scheme 2 which represents a two-step binding mechanism.
