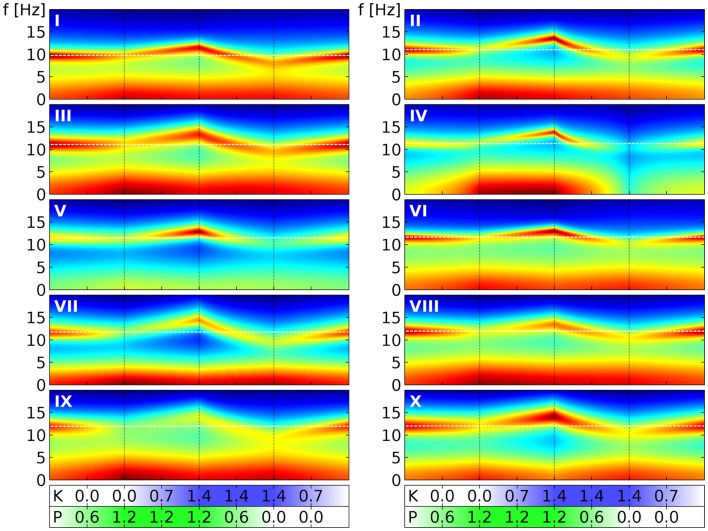
Figure 6.
Power spectral densities for all 10 selected parameter sets under drug variation. We use here the same four phases of drug variation as in Figure 4, as indicated by the dotted lines and quantified by bars below the main panels: first, P = 0 → 1.2 linearly, while K = 0. Then K = 0 → 1.4 linearly, while P = 1.2. Next P = 1.2 → 0, while K = 1.4. Finally, K = 1.4 → 0, while P = 0. Every panel corresponds to 1 of the 10 selected parameter sets, as indicated by a white roman numeral. The PSD for one specific (P, K) combination is indicated in the panel by a colored vertical line corresponding to frequencies from 0 to 20 Hz. Colors here indicate decibels of the PSD, with dark red corresponding to large, green to medium and dark blue to small values. (The “jet” colormap of Matlab has been mapped for each panel individually, to the full range of PSD decibel values shown in the panel.) A white dashed line indicates the α peak frequency in the absence of drugs.

