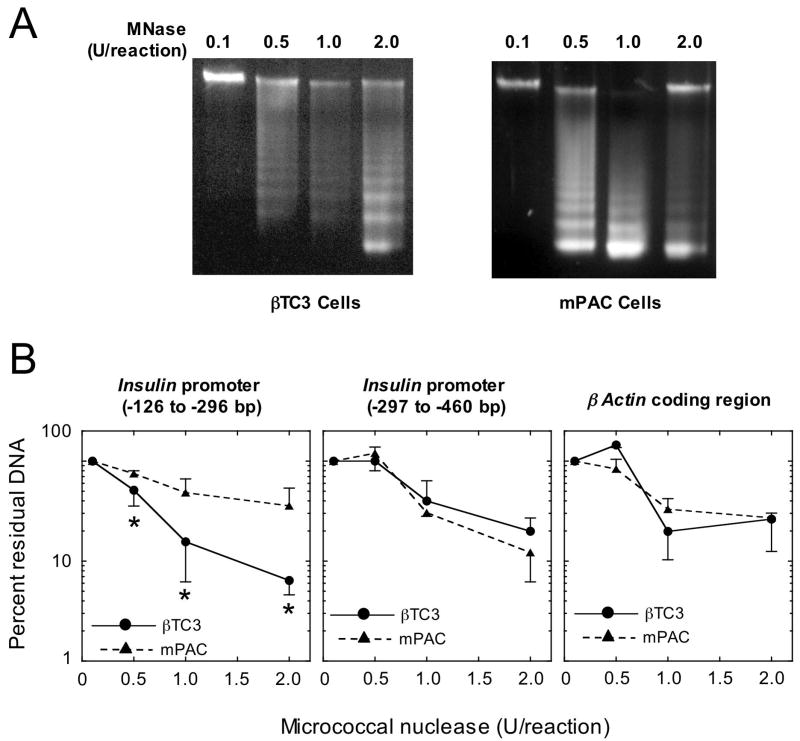
Figure 5. Chromatin accessibility by real-time PCR (ChART PCR).
Nuclei (which in total contained 100 ng of DNA) were freshly-isolated from βTC3 and mPAC cells as described in Materials and Methods, and subjected to digestion for 5 min. with varying amounts of MNase. A, 1% agarose gel analysis of total DNA from βTC3 and mPAC cells following MNase digestion with the concentations of MNase (units/reaction) indicated. B, quantitative real-time PCR analysis of residual insulin and β actin gene fragments following MNase digestion with the concentrations of MNase indicated. Locations of the amplified insulin promoter fragments are indicated as base pairs (bp) relative to the transcriptional start site. All data in panel B represent the mean ± S.E. of digestions from nuclei isolated on three separate occasions. “*” indicates that the values for the βTC3 cells shown are statistically different (p<0.05) than the corresponding values for mPAC cells.

