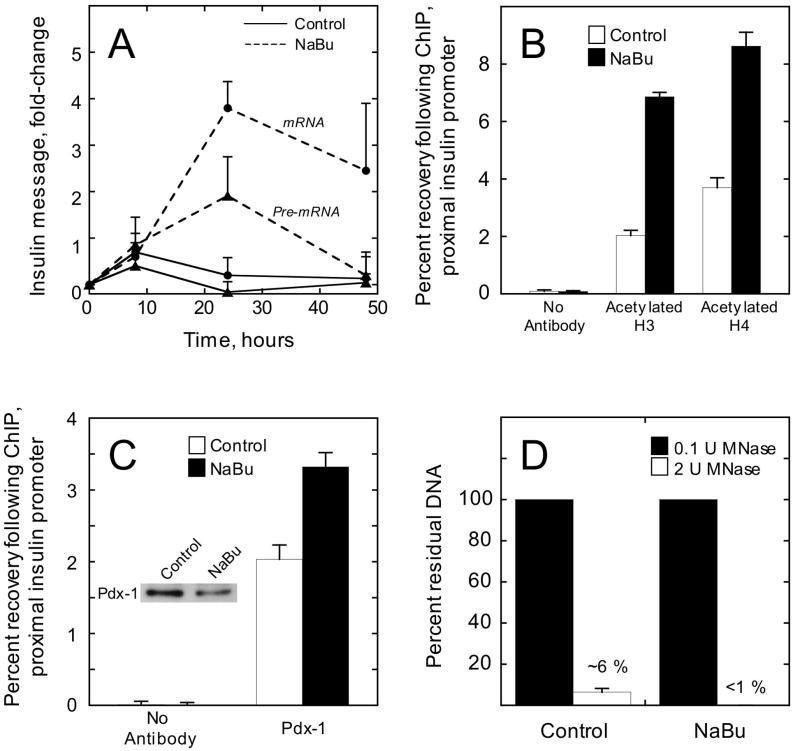
Figure 6. NaBu treatment of βTC3 cells enhances transcription, histone acetylation, and accessibility at the insulin gene.
A, insulin mRNA (closed circles) and pre-mRNA (closed triangles) were measured by real-time RT-PCR at various time points following treatment of βTC3 cells with either 2.5 mM NaBu or vehicle (control). Data represent the mean ± S.E. of three independent experiments, and were normalized to β actin mRNA levels. B, Recovery of the proximal insulin promoter (-126 to -296 bp relative to the transcriptional start site) following quantitative ChIP using antibodies to acetylated H3 or acetylated H4; βTC3 cells were treated with vehicle (control) or NaBu for 24 h. Data represent the mean ± S.E. of three independent ChIP experiments. C, recovery of the proximal insulin promoter following quantitative ChIP using Pdx-1 antibody; βTC3 cells were treated with vehicle (control) or NaBu for 24 h. Data represent the mean ± S.E. of three independent ChIP experiments; inset is an immunoblot showing Pdx-1 protein levels in control- and NaBu-treated βTC3 cells. D, percent residual proximal insulin promoter after digestion of control- and NaBu-treated βTC3 nuclei (100 ng total DNA) with 2 units MNase for 5 min. Data represent the mean ± S.E. of three digestions from nuclei isolated on three independent occasions.

