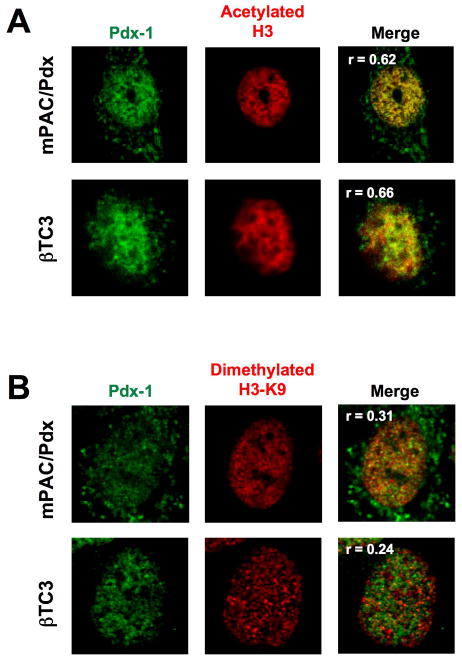
Figure 8. Pdx-1 in mPAC/Pdx and βTC3 cells localizes to regions of euchromatin.
mPAC and βTC3 cells were fixed and permeabilized, then treated with a mouse monoclonal antibody against Pdx-1 and either rabbit polyclonal antibodies against acetylated H3 (to visualize euchromatin) or dimethylated H3-Lys9 (to visualize heterochromatin), then secondarily treated with antibodies fused to Cy2 (green) and Cy3 (red) recognizing mouse and rabbit Fc portions, respectively. A, an mPAC/Pdx cell (top panels) and a βTC3 cell (bottom panels) were imaged in the green channel to visualize Pdx-1 and the red channel to visualize areas of acetylated H3, then the images were merged. Three-dimensional voxel intensity analysis of the merged image resulted in the Pearson overlap coefficients (r) as indicated in the merged panels. B, an mPAC/Pdx cell and a βTC3 cell were imaged in the green channel to visualize Pdx-1 and the red channel to visualize areas of dimethylated H3-Lys4, then the images were merged. Three-dimensional voxel intensity analysis of the merged image resulted in the Pearson overlap coefficients (r) as indicated in the merged panels.

