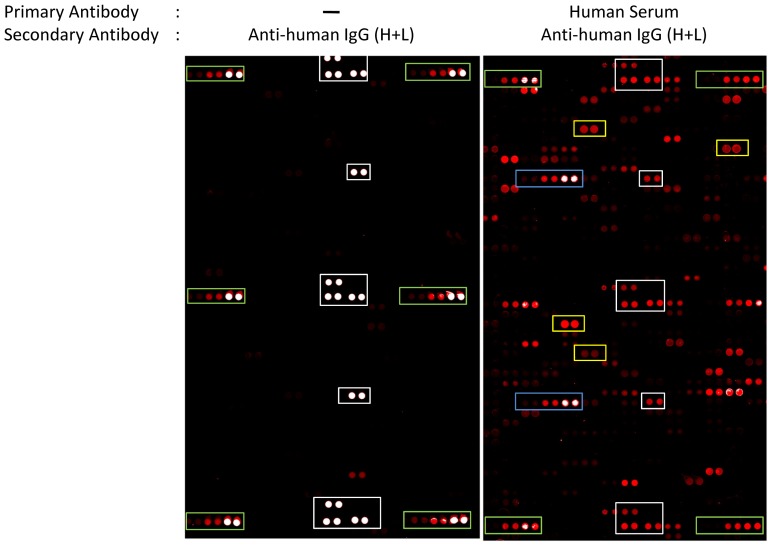
Figure 1. Representative images of human protein microarrays.
(Left) Small portion of a protein microarray containing 9,480 native human proteins probed with blocking buffer and secondary antibody as a quality control. (Right) Protein microarray probed with an individual human serum sample under the same conditions. Manufacturer’s controls (white boxes), gradient of IgG positive controls (green boxes), anti-human IgG controls (blue boxes) and examples of immunopositive reactions (yellow boxes) are indicated. In this study, all arrays were scanned at PMT setting of 600. Under this condition, the relative fluorescence unit (RFU) at saturation is around 75000 as exemplified by IgG controls (green boxes). The RFUs of BSA negative controls are under 1000. The coefficient of variance between duplicate spots averaged 4.7% ∼ 8.8%.

