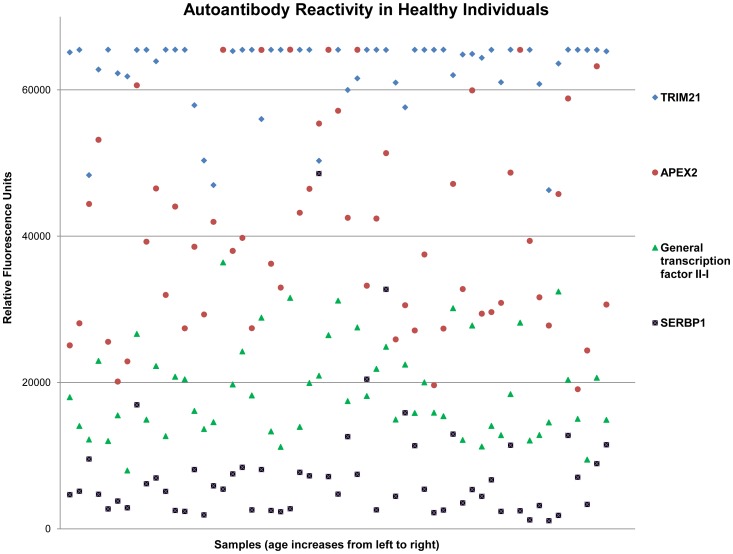
Figure 2. Representative autoantibody data showing their relative abundance in healthy individuals.
An example of the reactions of four highly prevalent autoantibodies in a population of healthy subjects is presented. The X axis indicates individual samples arranged in order of increasing age from left to right. Relative fluorescence units (RFUs) (Y axis) reflect the resulting antigen-antibody reaction detected on the protein microarrays. Four specific autoantigens [tripartite motif-containing 21 (TRIM21), APEX nuclease (apurinic/apyrimidinic endonuclease) 2 (APEX2), General transcription factor II-I and SERPINE1 mRNA binding protein 1 (SERBP1)] were chosen due to their high prevalence in > 60% of the healthy population. The clear lamination of signal intensities shown by each autoantibody-antigen reaction suggests comparable levels of these autoantibodies in the blood across the population

