Figure 1.
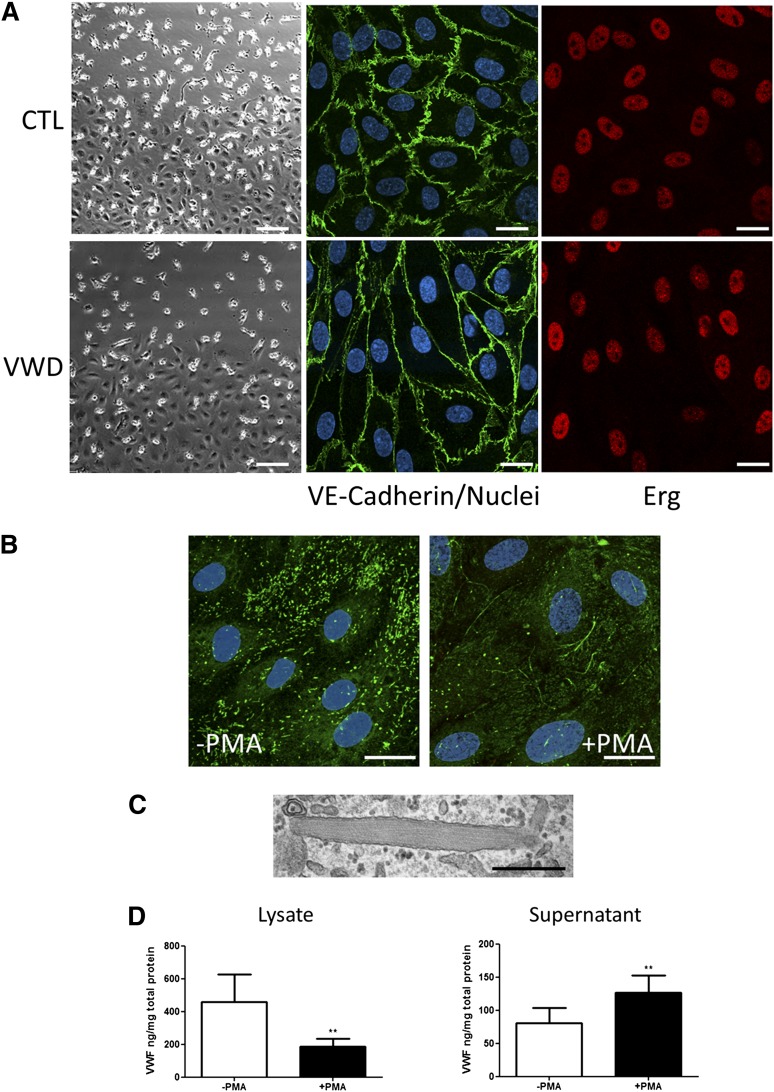
BOEC characterization and activation with PMA. (A) Representative images at the edge of a confluent colony of BOECs from a healthy control (top far left) and VWD patient (bottom far left). Scale bars represent 100 µm. Colonies of confluent BOECs were stained for VE-cadherin and Erg. Nuclei were stained with TO-PRO3 (scale bars represent 20 µm). (B) Representative image of healthy control BOECs stimulated with PMA or control to induce WPB exocytosis. BOECs were stained for IF with antibody to VWF and TO-PRO3 to identify the nuclei. Strings of VWF can be seen associated with the cell surface in the PMA-treated samples (scale bars represent 20 µm). (C) Representative EM image of a single WPB from a healthy control BOEC (scale bar represents 500 nm). (D) BOEC VWF was quantified by ELISA in total cellular lysate (left) or in cell culture supernatant (right) in the presence or absence of PMA stimulation (mean ± SEM from 9 healthy controls). **P < .01.

