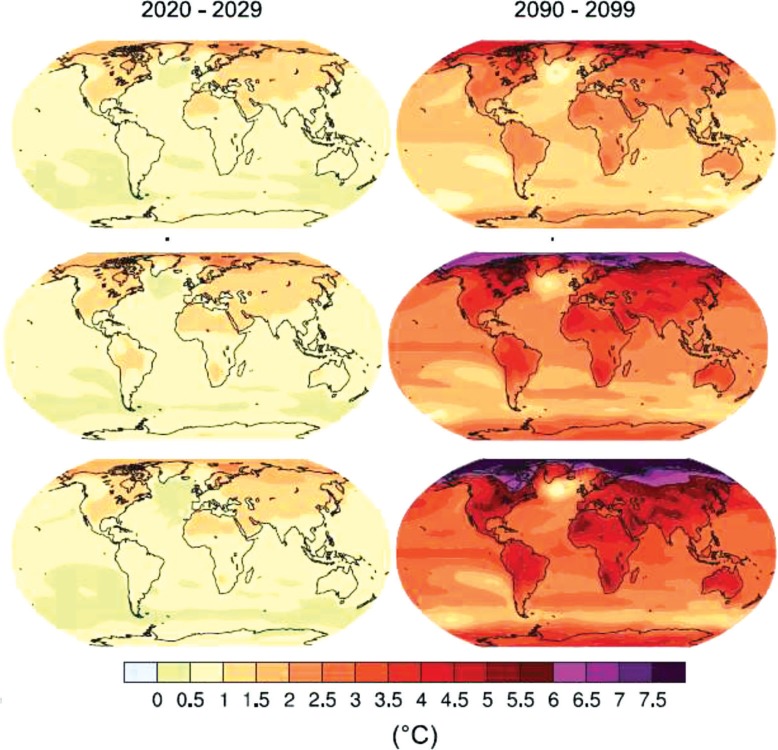
Fig. 1.
Current and projected temperature changes globally (11). The top maps show the estimated climate change for a 2°C global average change; the middle figure for a 3°C change and the bottom figure for a 4°C change. The new unpublished maps for RCP8.5 are very similar to the bottom maps. Baseline=1961–1990.

