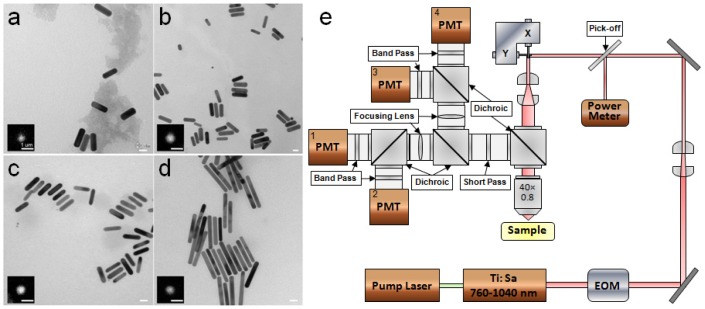
Fig. 1.
TEM images of gold nanorods used in this study: a, Au700; b, Au756; c, Au844; d, Au1060. Insets in a–d are TPL images of a single nanorod at 840 nm excitation within the spectral range of 400-720 nm. Scale bars in TEM and TPL images represent 20 nm and 1 µm, respectively. e, Schematic diagram of the laser scanning TPL microscope. EOM, electro-optic modulator; PMT, photomultiplier tube.

