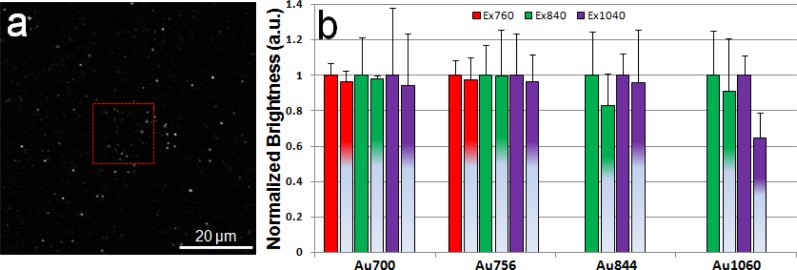
Fig. 3.
a, A typical TPL image (80 × 80 µm2) of Au1060 at 840 nm excitation acquired after 30 s laser irradiation at 2 mW in the red box (20 × 20 µm2), where a MPL signal drop of nanorods is observed. b, Averaged MPL signal of nanorods in the red box (second bar of the same color) was normalized to that of the nanorods outside the red box in the larger field of view (first bar of the same color) for nanorods with four aspect ratios at three excitation wavelengths. Error bar represents the standard deviation.

