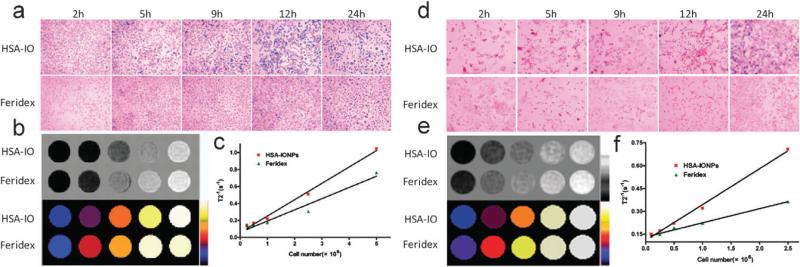
Fig. 2.
(a) Prussian blue staining of the HSA-IONPs/Feridex labeled macrophages. (b) Upper panel: the MRI phantoms of the iron-laden macrophages; bottom panel: colour map of the phantom results. (c) T2–1 vs. macrophage number curve. The linear correlation suggests good MRI sensitivity of the iron-laden cells. (d) Prussian blue staining of the HSA-IONP/Feridex labeled neural stem cells (NSCs). (e) The black-white and colour maps of the MRI phantom results of the iron-laden NSCs. (f) T2–1 vs. cell number curve of the iron-laden NSCs.

