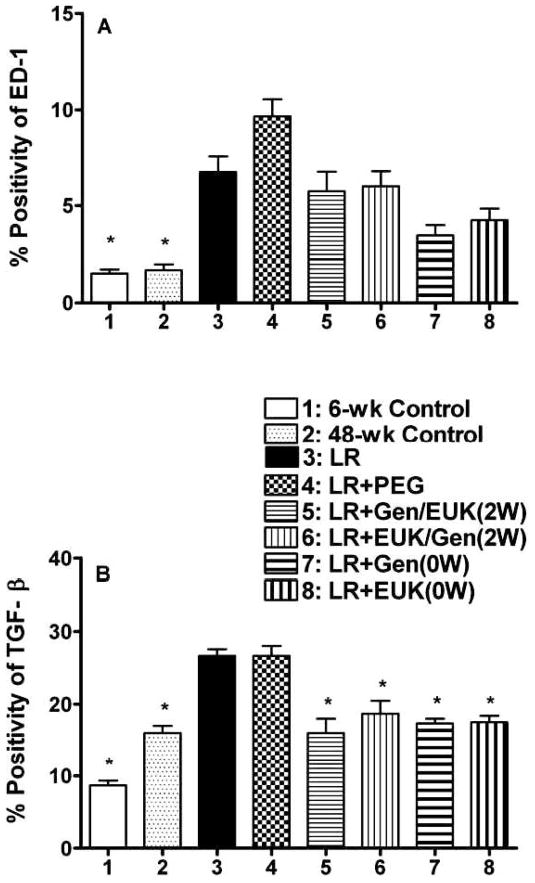
FIG. 6.
Analysis of macrophage activation and TGF-β1 levels in the lungs of the rats at time of euthanasia at 48 weeks after irradiation. Panel A: Analysis of macrophage activation (ED-1 staining) as percent positivity (the ratio of positive pixels/total number of positive and negative pixels in the tissue section with air spaces excluded). Panel B: Analysis of TGF-β1 staining as percent positivity. Each bar represents the mean (±SEM) for all rats available for analysis (Group 1 n = 4; Group 2 n = 8; Group 3 n = 3; Group 4 n = 5; Group 5 n = 5; Group 6 n = 3; Group 7 n = 4 and Group 8 n = 4). Labeling of the treatment groups is as indicated in the legend to Fig. 2. Six-week control animals were euthanized at the start of the experiment and 48-week controls were euthanized at 48 weeks post irradiation. The asterisks indicate groups that are significantly different from the LR group in each panel.

