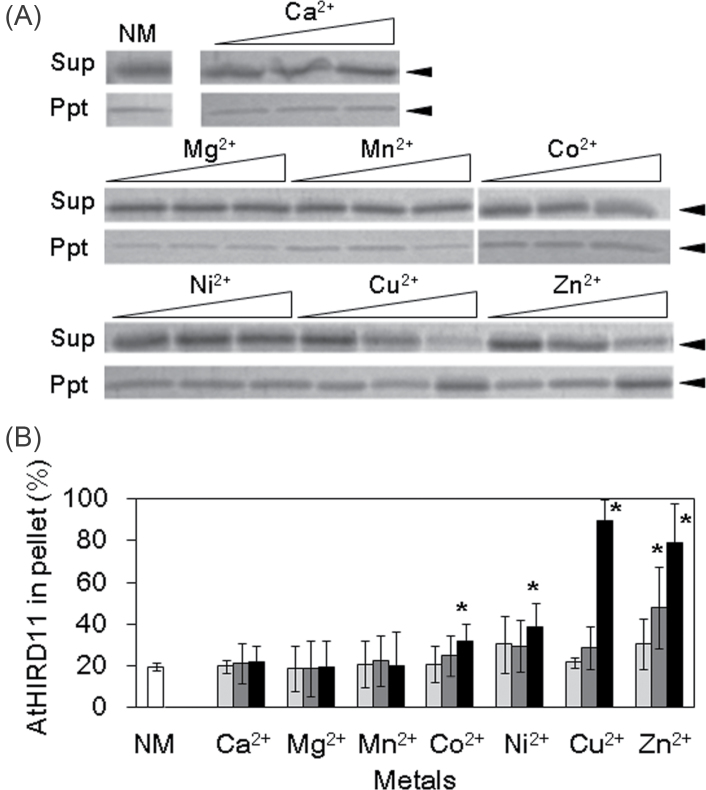
Fig. 5.
Effects of metals on association species formation of AtHIRD11. Different kinds of metals were added to the AtHIRD11 solutions (4.6 µM), and then the mixtures were centrifuged. The resultant supernatants (Sup) and pellets (Ppt) were resolved by SDS–PAGE. (A) The SDS–polyacrylamide gel was stained with colloidal Coomassie blue. Open triangles represent levels of metal concentrations. For each metal, the concentration increases from left to right in three steps. The [AtHIRD11]:[Cu2+] ratios are 1:0.5 (4.6 µM:2.3 µM, left), 1:5 (4.6 µM:23 µM, middle), and 1:50 (4.6 µM:230 µM, right). NM indicates AtHIRD11 alone (without metal). Arrowheads show the size of AtHIRD11. (B) Relative intensities of the AtHIRD11 bands in the pellet fractions. The sums of band intensities in supernatants and those in pellets are expressed as 100%. The [AtHIRD11]:[metals] ratios are 1:0.5 (light grey columns), 1:5 (dark grey columns), and 1:50 (black columns). The concentrations of AtHIRD11 and Cu2+ were the same as in A. Values and bars indicate means and SD of four measurements, respectively. *Significant differences (P < 0.05) in comparison with the NM condition (a white bar) were determined by Student’s t-test.

