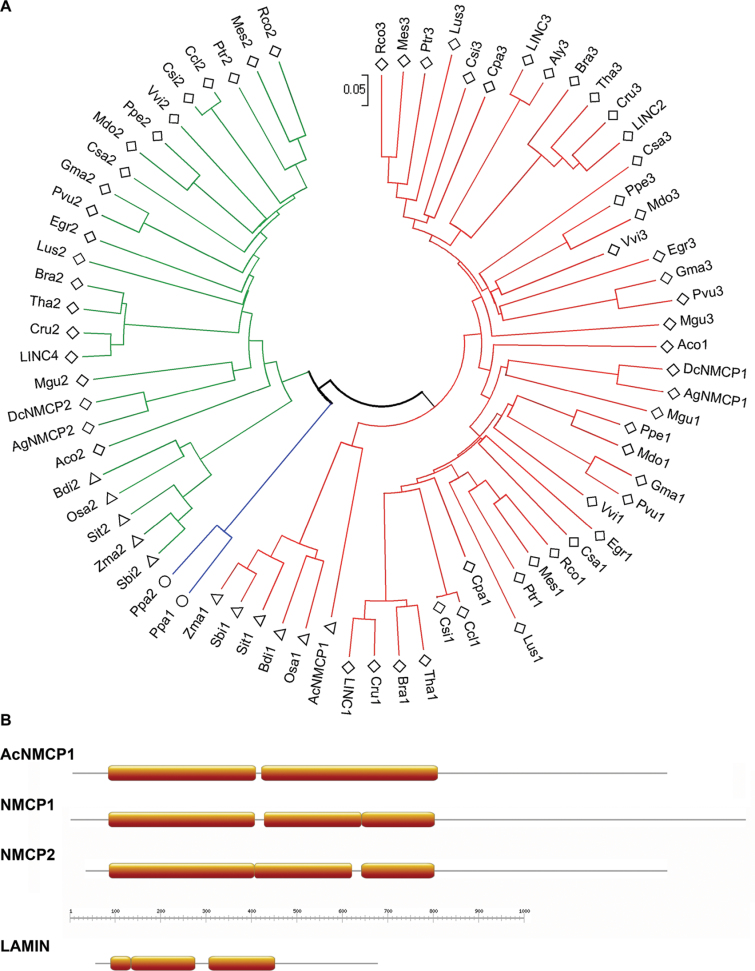
Fig. 1.
Classification of NMCPs: evolutionary relationships and predicted protein structures. (A) Phylogenetic relationship of NMCPs inferred using the neighbour-joining method. Evolutionary distances were calculated using the p-distance method and are presented as the number of amino-acid differences per site. The phylogenetic tree is drawn to scale. The sequences classified as type 1 NMCP are marked in red and type 2 are in green, with the two members in Physcomitrella patens in blue. Dicotyledon species are represented by rhombi; monocotyledons by triangles; and moss by circles. Sequence accession data are shown in Supplementary Table S1. (B) Schematic representation of the coiled-coil prediction (MARCOIL) for AcNMCP1, typical NMCP1 and NMCP2, and lamin (orange boxes).

