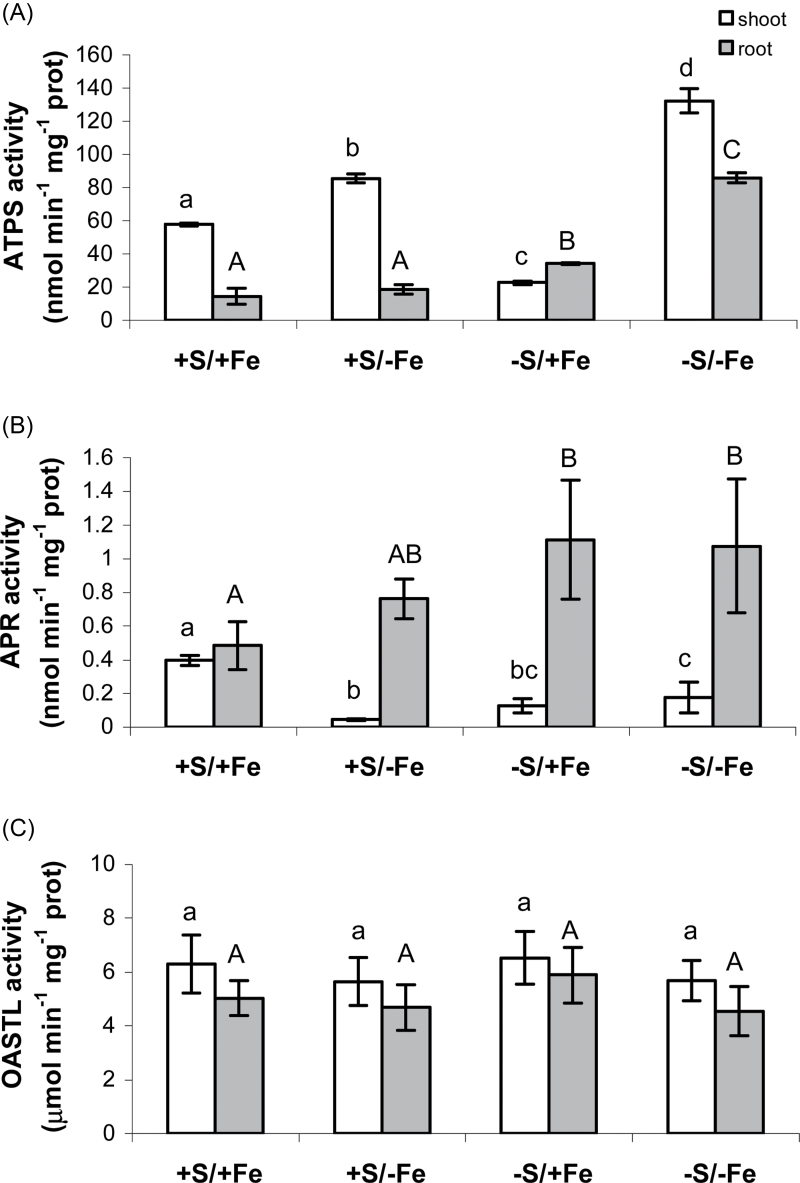
Fig. 3.
Changes in shoot (white bars) and root (grey bars) ATPS (nmol ATP min–1 mg–1 protein) (A), APR (nmol min–1 mg–1 protein) (B), and OASTL (μmol min–1 mg–1 protein) (C) activities of wheat plants grown for 11 d in NS at 0 (–e) and 100 (+Fe) μM FeIII-EDTA and under two S concentrations in the NS (0 and 1.2mM, –S and +S, respectively). Data are means ±SD of four independent replications run in triplicate. Statistics are as in Fig. 1.

