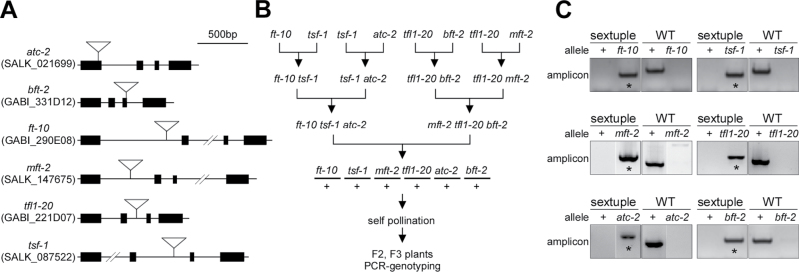
Fig. 1.
Map of T-DNA insertions of mutants used in this study and strategy for generating the mutant population. (A) T-DNA insertions in the FT/TFL1 family mutants used in this work. Closed boxes indicate exons; solid lines indicate introns; inverted triangles indicate T-DNA insertion. Both the allele name and its public T-DNA library identifier (Alonso et al., 2003; Rosso et al., 2003) are presented. (B) The strategy for generating a comprehensive set of mutants of the FT/TFL1 family genes. (C) Confirmation of the genotype of sextuple (ft-10 tsf-1 mft-2 tfl1-20 atc-2 bft-2) mutants by PCR. For example, ft-10 genotyping produced a single band of 926bp in size from the homozygous ft-10 allele (*), whereas the wild-type allele (WT, +) produced a single band of 1392bp in size. Genotyping primer information and the sizes of the expected amplicon of each mutant allele are provided in Table S1.

