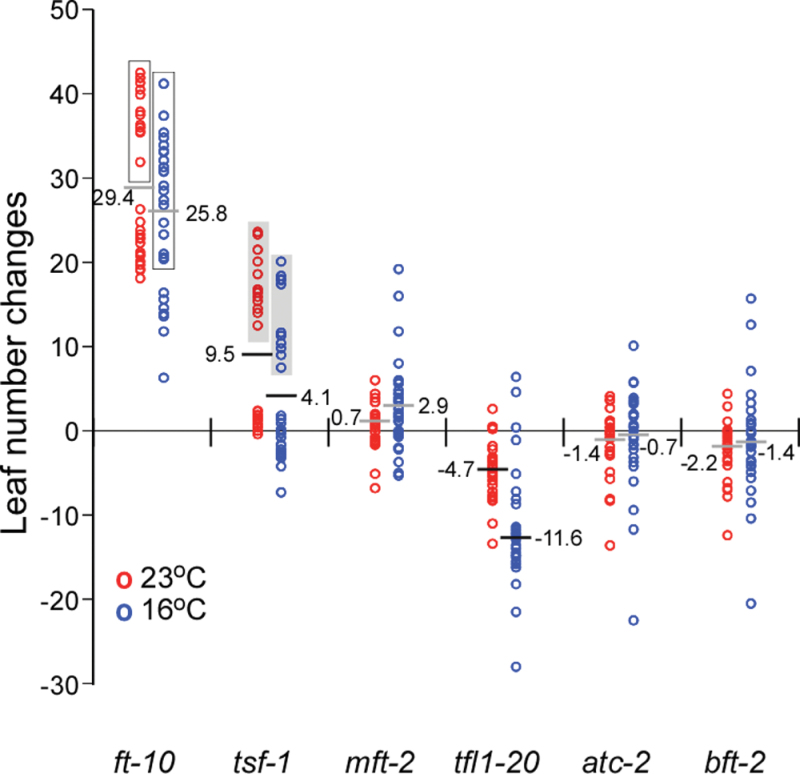
Fig. 5.
Plotting of leaf number changes in all mutant combinations caused by introduction of each single mutation at 23 and 16°C. Open boxes indicate leaf number changes by ft-10 in the presence of tsf-1 (except ft-10 mft-2 bft-2 mutants at 16 °C). Grey boxes indicate leaf number changes caused by tsf-1 in the presence of ft-10 (except ft-10 tsf-1 mft-2 bft-2, ft-10 tsf-1 atc-2 bft-2, and ft-10 tsf-1 mft-2 tfl1-20 mutants at 16 °C). Horizontal bars indicate the average leaf number changes caused by the introduction of each mutation: note that tfl1-20 and tsf-1 caused a stronger effect at 16 °C than at 23 °C (black bars, P < 0.05), and that ft-10, mft-2, atc-2, and bft-2 did not show a clear effect (grey bars).

