Fig. 7.
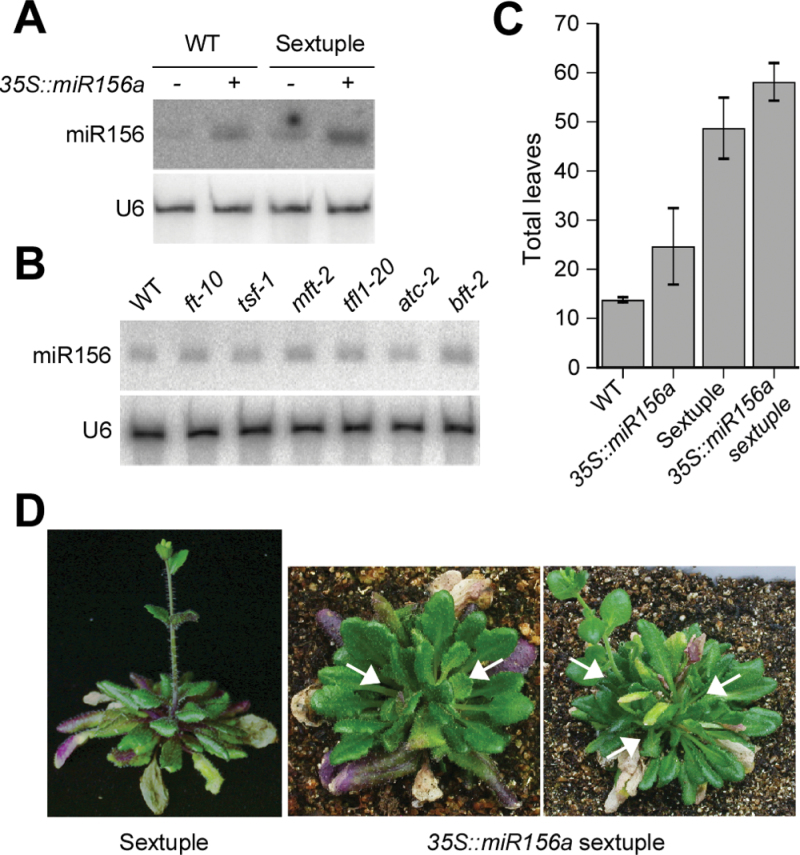
Flowering phenotype of 35S::miR156a ft-10 tsf-1 mft-2 tfl1-20 atc-2 bft-2 mutants under long-day conditions. (A and B) Small RNA blots showing expression levels of miR156 in transgenic plants generated in this study (35S::miR156a plants and 35S::miR156a ft-10 tsf-1 mft-2 tfl1-20 atc-2 bft-2 mutants) (A) and in single mutants (B); U6 RNA served as a loading control (Lee et al., 2010). (C and D) Flowering time (C) and morphology (D) of 35S::miR156a ft-10 tsf-1 mft-2 tfl1-20 atc-2 bft-2 mutants under long-day conditions. Note multiple rosettes generated from 35S::miR156a ft-10 tsf-1 mft-2 tfl1-20 atc-2 bft-2 mutants (arrows). Total leaf number of ft-10 tsf-1 mft-2 tfl1-20 atc-2 bft-2 mutants in (C) came from Table 1.

