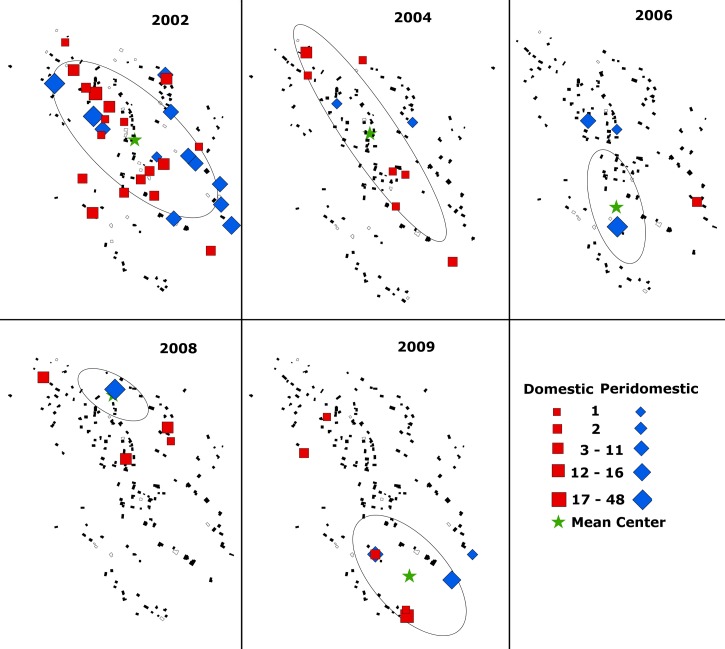
Figure 5.
Spatial and temporal distribution of Triatoma dimidiata infestation within La Brea, Guatemala by survey year (2002–2009). Data represent vector densities in peridomestic (blue diamond) and domestic (red square) habitats. Symbols are sized in proportion to the vector density observed. Non-infested homesteads (black polygons) and homesteads that were not surveyed (grey polygons) are also represented. The geographic center of vector abundance (mean ± 1 SD) for each year is identified by a star and ellipse.

