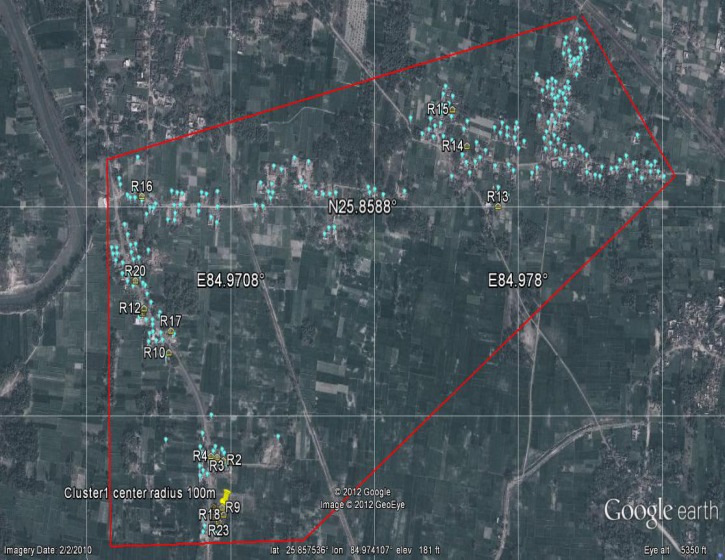
Figure 3.
Google Earth image of households and VL cases from 2009 to 2011 in Rasulpur. The red line around the village is the study area perimeter. Yellow houses (R1–23) represent case households, blue balloons represent non-case households, and the yellow pushpin marks the center of the case cluster (16/27 cases, RR = 11.89, P < 0.001).

