Fig. 1.
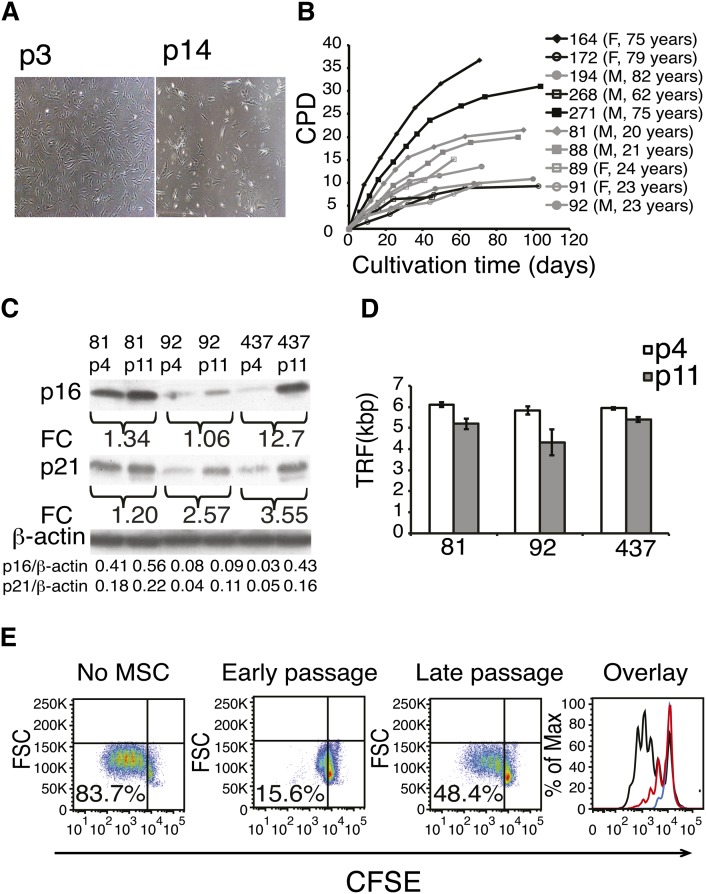
Long-term cell culture of hBMSCs. A: A representative example of cell morphology at passage 3 and in senescence (p14) at a magnification of 40×. B: hBMSCs were isolated from the human bone marrow of ten donors and cultured until senescence was reached. Cumulative population doublings (CPD) was calculated in relation to the starting point of the cell culture at every passage (F, female; M, male). C: Western plot analysis of cell cycle components p16 and p21 of early and late passages of three different hBMSC donors. Fold change (FC) represents the increase of band intensities in late-passage cells compared with early-passage cells. Intensities of the p16 and p21 bands normalized to β-actin are listed on the last rows. D: Telomere lengths (TRF, terminal restriction factor) were determined in early- and late-passage cells from three different cell lines. Results are show as mean + SD of three technical replicates. Telomere lengths were shortened on average 1 kb ± 0.5 (Student t-test P = 0.03, n = 3). E: Immunosuppressive capacity of early and late passages analyzed by coculture assay. 5(6)-Carboxyfluorescein diacetate N-succinimidyl ester (CSFE)-labeled peripheral blood mononuclear cells (PBMC) were cultured with hBMSC in ratio of 1:10 for four days. T-cell proliferation was stimulated with monoclonal CD3 antibody, and proliferation was analyzed as CFSE dilution by flow cytometry. In the overlay panel, black line indicates no hBMSCs, red line indicates late-passage hBMSCs, and blue line indicates early-passage hBMSC. X-axis shows the fluorescence intensity of CFSE on a logarithmic scale, and Y-axis shows the cell count. Experiment repeated three times with similar results using hBMSCs and PBMCs from independent donors.

