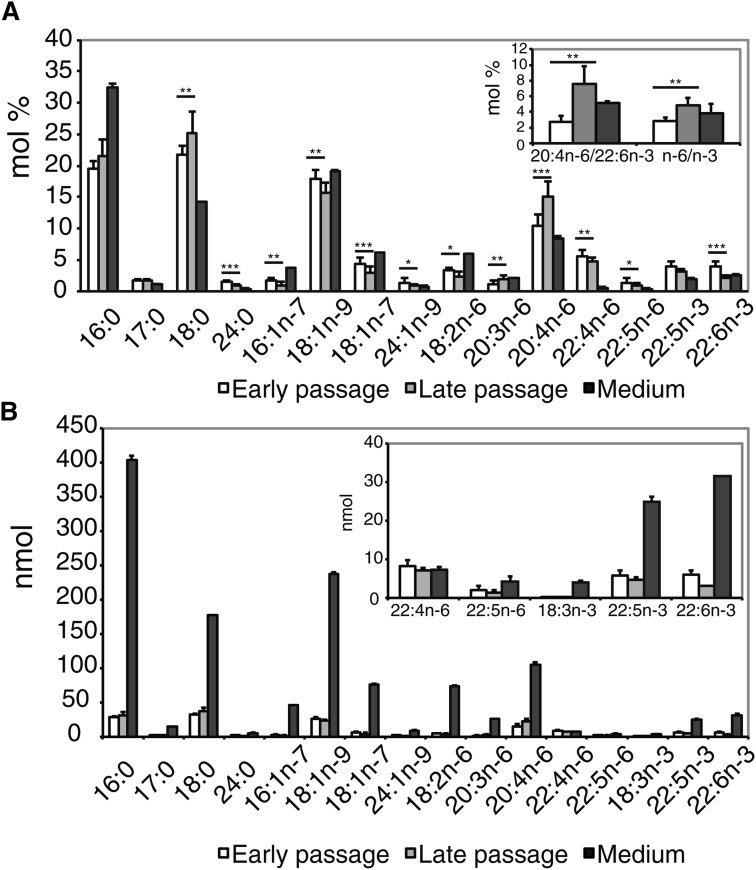
Fig. 5.
Effect of long-term culture on the FA composition of hBMSC. Samples for gas chromatographic FA analysis were collected as described in Fig. 4. FAs were analyzed as methyl esters. Results for the cells from the earliest and last passages were expressed as mean + SD, n = 10 (*P < 0.05, **P < 0.01, ***P < 0.001). For the medium, three replicates were analyzed. A: Molar percentages of FAs from the earliest passage (white bar) and the last passage (light-gray bar) compared with those of the medium (dark-gray bar). Insert shows the ratios of 20:4n-6 to 22:6n-3 and n-6 PUFAs to n-3 PUFAs in the earliest and last passages compared with values of the medium. B: Total amounts (nmol) for each FA in the cells and surrounding culture medium. Insert shows the total amounts (nmol) of some PUFA species in enlarged scale.

