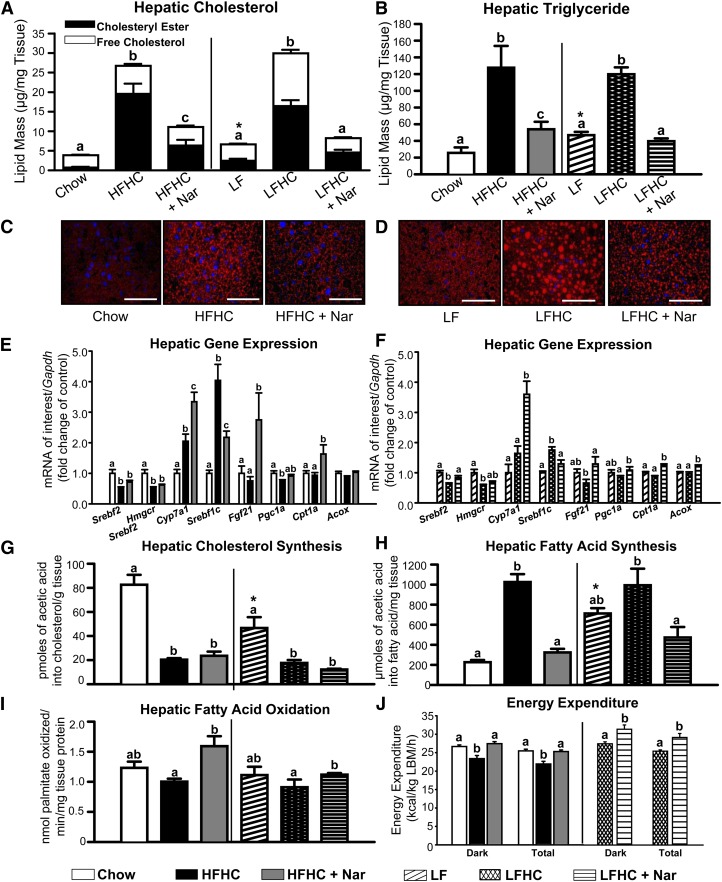
Fig. 2.
Hepatic cholesterol and FA metabolism in cholesterol-fed animals with naringenin treatment. (A) Hepatic total cholesterol (whole bar), cholesteryl ester (black bar), and free cholesterol (open bar). Values are the mean ± SEM. Different letters are statistically different (P < 0.05) for each lipid parameter. (B) Hepatic triglyceride mass. (C, D) Representative fluorescence micrographs of liver sections stained with Oil Red O and Hoechst 33258 to visualize neutral lipid droplets (red) and nuclei (blue). Scale bar = 75 μm. (E, F) Hepatic mRNA expression (n = 10–12/group). (G) Cholesterol synthesis in the liver (n = 6–8/group) determined by incorporation of [1-14C]acetic acid into cholesterol. (H) FA synthesis in the liver (n = 6–8/group) obtained 60 min post intraperitoneal injection with [1-14C]acetic acid. (I) Hepatic FA oxidation (n = 6–8/group) determined by [3H]palmitate conversion to H2O. Values are the mean ± SEM. (J) Energy expenditure determined by indirect calorimetry (CLAMS system) during the light and dark cycles (7:00 PM – 7:00 AM). Measurements were collected every 10 min. Each bar represents the mean ± SEM, normalized to lean body mass (LBM) for the entire dark cycle or total 24 h period (n = 6/group). Different letters are statistically different (P < 0.05). * P < 0.05 between Chow and LF.

