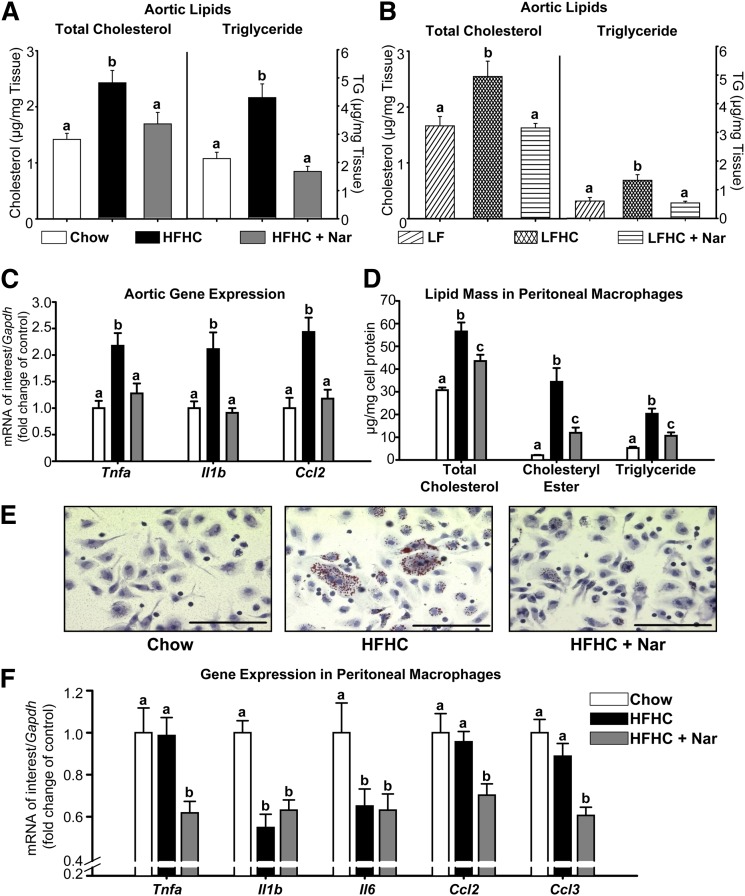
Fig. 6.
Prevention of aortic lipid accumulation and inflammation in cholesterol-fed mice treated with naringenin. (A, B) Total cholesterol and triglyceride concentrations in whole aorta (n = 6–8/group). (C) mRNA expression in whole aorta (n = 6–7/group). (D) Male Ldlr−/− mice were fed chow or HFHC ± Nar for 12 weeks (n = 16/group), followed by intraperitoneal injection with thioglycollate. After five days, peritoneal macrophages were harvested and analyzed for cellular lipid concentrations. (E) Representative photomicrographs of peritoneal macrophages stained with Oil Red O and hematoxylin. Scale bar = 100 μm. (F) Peritoneal macrophage mRNA expression (n = 10–14/group). Values are the mean ± SEM. Different letters are statistically different (P < 0.05).

