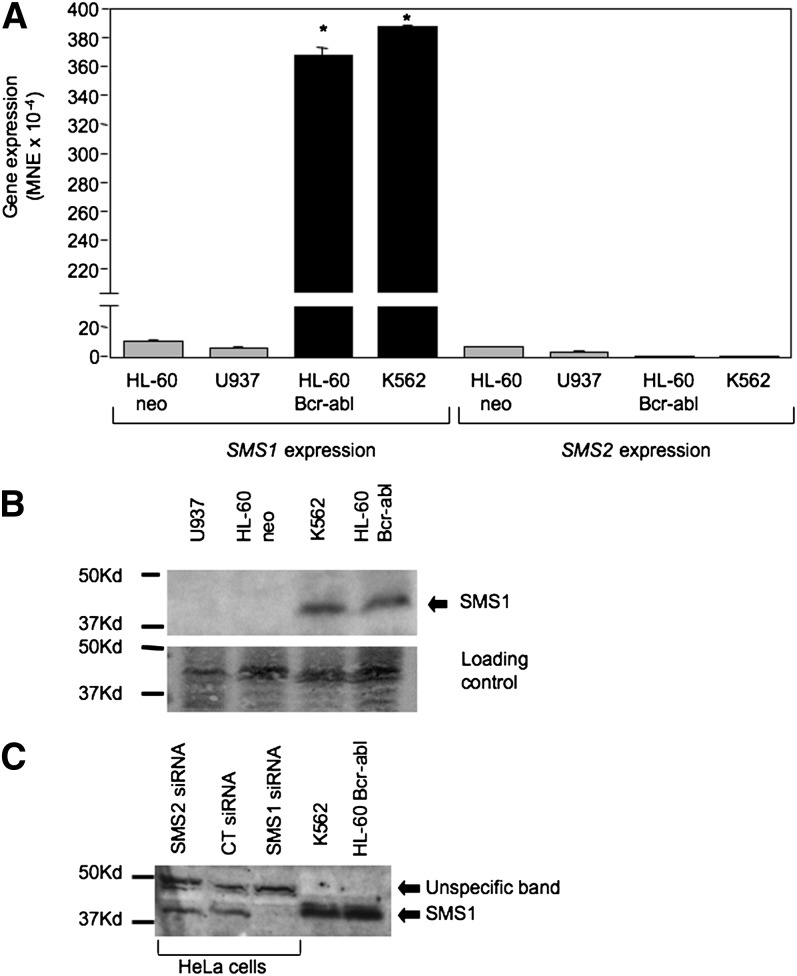
Fig. 2.
Bcr-abl induced up-regulation of Sms1. A: Expression of BCR-ABL (HL-60/Bcr-abl and K562) caused an approximately 35-fold increase of SMS1 expression compared with Bcr-abl-negative cells (HL-60 neo and U937), whereas it caused a drop of SMS2 expression compared with Bcr-abl-negative cells. Expression of SMS1 and SMS2 were determined by real-time PCR as indicated in the Materials and Methods section and normalized against β-actin. B: Total membrane fractions were collected from exponentially growing cells, and Western blotting analysis using 80 μg of proteins was performed as described in the Materials and Methods section using nonpurified polyclonal antibodies raised against recombinant full-length Sms1 protein (ExAlpha Biologicals). Equal loading was confirmed by Ponceau staining (loading control panel). C: The identity of the Sms1 band was determined based on the specific disappearance of the same molecular weight band in Hela cells after siRNA-mediated SMS1 down-regulation as compared with cells transfected with a scrambled siRNA (CT siRNA) or a siRNA against SMS2 (SMS2 siRNA). These results are representative of two separate experiments. Where error bars are not visible, the error bar is too small compared with the scale of the y axis. Asterisk indicates significance to HL-60/neo (P < 0.05). MNE, mean of normalized expression.

