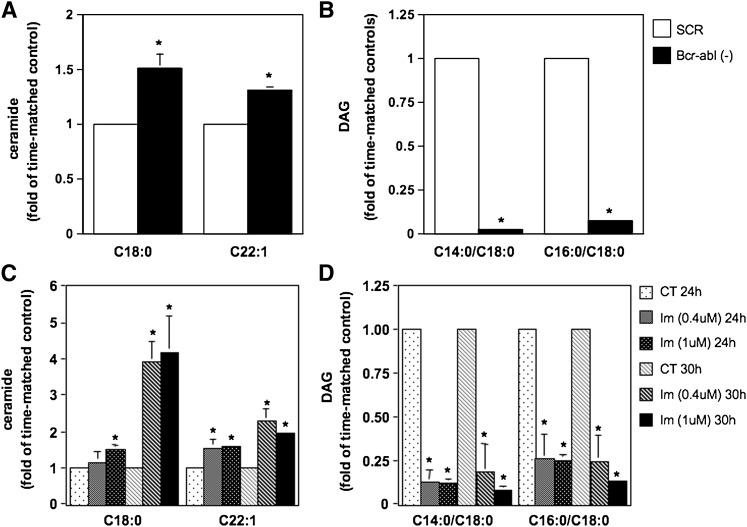
Fig. 6.
Inhibition of Bcr-abl induced accumulation of ceramide and reduction of DAG levels. A and B: HL-60/Bcr-abl cells were treated with scrambled siRNA control (SCR) or BCR-ABL siRNA (Bcr-abl-) for 36 h. Two million cells were collected from each experimental condition, and the levels and species of ceramide (A) and DAG (B) were analyzed from three independent experiments. C and D: K562 cells were treated with imatinib (Im, 0.4 or 1 μM) for 24 h and 30 h, and the levels of different species of ceramide (C) and DAG (D) were measured by mass spectrometry. Levels are reported as fold changes versus time-matched control (SCR or CT) because of the large variation in baseline values. A: C18:0 ceramide (pmoles/nmole Pi), SCR: 0.069 ± 0.009; C22:1 ceramide (pmoles/nmole Pi): SCR: 0.11 ± 0.004. B: C14:0/C18:0 DAG (pmoles/nmole Pi): SCR: 0.526 ± 0.027; C16:0/C18:0 DAG (pmoles/nmole Pi): SCR: 7.04 ± 0.24. C: C18:0 ceramide (pmoles/nmole Pi), CT 24 h: 0.043 ± 0.006, CT 30 h: 0.031 ± 0.001; C22:1 ceramide (pmoles/nmole Pi): CT 24 h: 0.083 ± 0.030, CT 30 h: 0.092 ± 0.017. D: C14:0/C18:0 DAG (pmoles/nmole Pi): CT 24 h: 0.28 ± 0.067, CT 30 h: 0.60 ± 0.073; C16:0/C18:0 DAG (pmoles/nmole Pi): CT 24 h: 4.87 ± 1.023, CT 30 h: 9.66 ± 1.35. Where standard deviations are not visible, the standard deviation is too small compared with the scale of the y axis. Asterisk indicates significant difference between HL-60/Bcr-abl(-) and SCR control or imatinib-treated and control cells (P < 0.05). CT, control; Im, imatinib-treated cells. Reported in the graphs are representative ceramide and DAG species.

